Understanding downhole vibration transmission and disruption
Drilling And Completion TechnologyUnderstanding downhole vibration transmission and disruptionInvestigation of data from dual downhole vibration sensors in three Gulf of Thailand wells results in successful vibration mitigation.
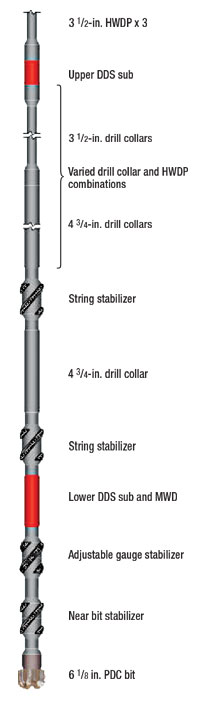
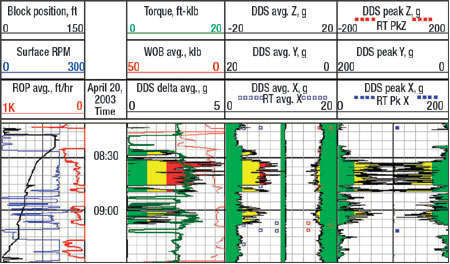
Identification of drillstring vibration transmission, attenuation and interaction was important in several wells for ChevronTexaco where vibrations had damaged several MWD and BHA components at two offshore rigs in the Gulf of Thailand. This article presents a study on the investigation of vibration transmission, attenuation and interactions based on data obtained from dual, downhole vibration sensors. The results of the study have been effective in reducing harmful vibrations and in improving the performance of BHA components. INTRODUCTION A single Drillstring Dynamics Sensor (DDS)* tool was run on several wells over a period of time on two rigs operated by ChevronTexaco in the Gulf of Thailand. This tool had been used to identify vibration mechanisms believed to have damaged MWD, BHA and other drillstring components. An additional DDS sensor was recently run, located within a 3-1/2-in. heavy weight drill pipe (HWDP), 835 ft from the bit and 745 ft above the last stabilizer, Fig. 1. To the knowledge of the authors, this is the first time a full tri-axial vibration sensor has been placed in a location far outside the traditional BHA components. The original SPE paper, on which this article is based, is also believed to be the first report to provide detailed analyses of such data to determine vibration transmission. Downhole vibration has long been recognized as a complex and costly problem that has often resulted in failures of MWD tools and BHA components, and in poor drilling efficiency. Following a rash of vibration related component failures, this study set out to determine the mechanisms responsible for these failures. Various factors were examined, including BHA design, drilling parameters, bit types and the formation. The well azimuth was also examined in an attempt to find out if it had any influence on downhole vibration. Various BHA configurations were run, with drill collar and heavy weight drill pipe (HWDP) configurations of 6/21, 9/15, 12/12 and 12/9 used. An Adjustable Gauge Stabilizer (AGS) was run in all cases, with three different PDC bit types. Two DDS subs were run in the successive drilling of the 6-1/8-in. production sections. The lower sub was made up to the MWD tool so that real-time data could be transmitted while drilling. It was located 21 ft from the bit. The upper DDS sub was placed three joints from the top of the HWDP, some 835 ft from the bit, as a stand-alone, record-only configuration. No appreciable increase or decrease in vibration levels was evident as a result of these changes in the BHA. Drilling parameters were kept relatively constant while drilling the 6-1/8-in. sections. However, WOB and RPM were adjusted periodically, usually in response to high surface torque which, as explained below, is found to correlate closely with stick-slip vibration. In wells where real-time vibration data was not transmitted, surface torque was often the only indication that stick-slip was occurring. While this study did not set out to examine relative merits of various bit designs, it soon became apparent that higher magnitude vibration resulted from more aggressive bits. There is also a close correlation to vibration while drilling sandstone in many instances, although the more aggressive PDC bits exhibit vibration across mixed lithologies. The Gulf of Thailand basin, which includes Benchamas and Tantawan fields, is bound by an elongated series of north-south and northwest-southeast trending Tertiary basins and collapse grabens, formed as a result of extensional tectonic stress. Wells are usually directionally drilled parallel to the trapping fault, and encounter multiple stacked reservoirs. A possible correlation between well azimuth and downhole vibration was found to be difficult because the majority of wells examined were drilled in the NW quadrant, due to the relative positions of the platform and the reservoirs. TOOL DESCRIPTION The DDS tool comprises three mutually orthogonal accelerometers, used to measure three axes of accelerations, X, Y and Z. The X-axis is used to measure both lateral and radial accelerations. The Y-axis is used to measure both lateral and tangential accelerations; and the Z-axis measures axial acceleration. Peak, average and burst acceleration data for all three axes are recorded downhole. The peak measurement represents the highest acceleration that has occurred over a specified time period, and the average measurement represents the average acceleration over the same period, usually four seconds. Burst, or instantaneous, data is a frequency scan of the accelerometers at 100, 500, 1,000 (most common) or 2,000 Hz. The vibration magnitude is then tagged to this frequency data. The frequency analysis can be used to identify vibration mechanisms, such as whirl, and to determine the source of a vibration. DDS DATA ANALYSIS Described in this section are the topics of: 1) torsional vibration; 2) harmonic induced vibration, the “whirl” concept; 3) vibration’s relation to sandstone; 4) burst frequency; and 5) vibration interaction for torsional vibration and whirl. Transmission of torsional vibration. The wells for ChevronTexaco were dominated by torsional vibration and, at the most extreme, by stick-slip. While difficult to quantify real-time, post-well analysis from Sperry-Sun’s DDS sensor revealed how torsional vibration recorded using the sensor tools was calculated by a difference between Average X and Average Y acceleration (Delta Average). The separation is color coded so that: <1 g indicates low vibration; 1 – 2 g for medium vibration and >2 g for high vibration. Fig. 2 taken from Well B shows the lower DDS sensor over a 2-1/2-hr period. Significant torsional vibration was indicated by the large separation between Average X (largely radial accelerations) and Average Y (mainly tangential accelerations) and by the high DDS Delta Average value. There are four significant torsional vibration events recorded over this time frame – the event at time 15:05 is not considered significant.
A second figure in the original paper shows data taken during the same time period shown in Fig. 2, but recorded by the upper DDS sensor. It shows that the same vibration recorded in the lower sensor is also recorded in the upper sensor. Also, with some allowance for accelerometer calibrations, the magnitude of the acceleration and, therefore, the vibration recorded in both sensors was very similar, suggesting little attenuation along the drillstring. Fig. 3 is a plot combining upper and lower DDS data for the same time period. The separation between Average X and Average Y identifies torsional vibration and shows that torsional vibration is transmitted along the drillstring. What is also clear is that there is very little vibration attenuation along the drillstring.
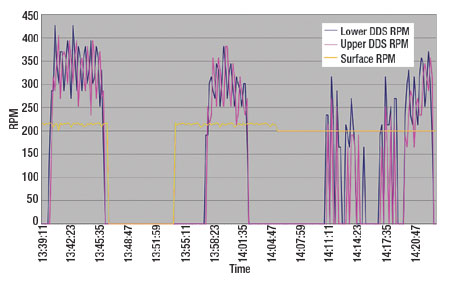
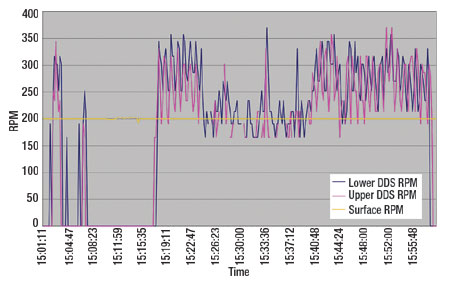
The very low Delta Average data indicates that the drillstring is rotating smoothly at the applied surface RPM during non-stick-slip periods. During stick-slip, drillstring rotation is no longer smooth; hence, the separation in the two accelerometers. The magnitude of Delta Average acceleration made it possible to calculate the downhole RPM during stick-slip events. Several papers have been written describing and explaining the increase in downhole RPM.1 – 4 The data depicted in Fig. 2 and the second figure in the paper were used to calculate the downhole RPM. Figs. 4 and 5 show how downhole RPM increases during stick-slip to 2 – 2-1/2 times surface RPM when the Delta Averages were recorded as 1 – 2 g. The figures also show that RPM in the drillstring calculated for upper and lower DDS acceleration is very similar, adding further evidence that torsional vibration shows little attenuation along the drillstring.
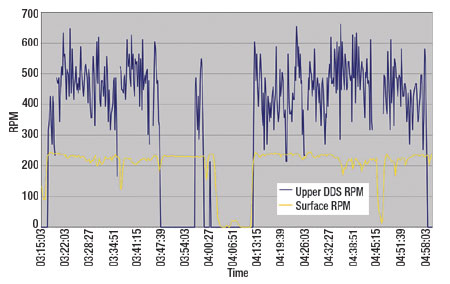
Fig. 6 shows a period of very severe stick-slip during a run on Well A. Here the average Delta Average acceleration is 3 – 4 g and commonly records over 5 g. Using this data, Fig. 7 shows calculated RPM and surface RPM for the same interval. Because of the higher Delta value, the calculated downhole RPM was much higher, predominantly 400 – 600 RPM. It should be noted that the RPM was calculated from the upper DDS acceleration only because the lower sensor was severely damaged.
An important additional effect of torsional vibration is lateral vibration. This can be initiated during the slip phase of stick-slip as the bit and BHA spin freely at several times the surface RPM.5,6 Figs. 6 and 8, from two different wells, show high magnitude stick-slip vibration occurring with lateral vibration. This phenomenon is indicated by high magnitude Peak X and Y data as the BHA strikes the borehole wall during the slip phase. Data depicted here is taken from lower and upper DDS sensors, respectively. There is no correlation to the other DDS runs in these BHAs because of severe damage to components.
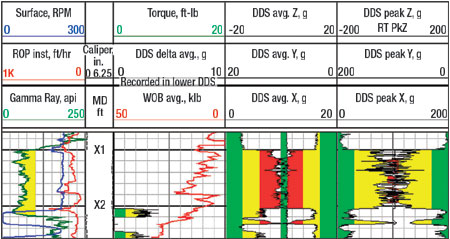
Identification and proof of transmission of torsional vibration along the drillstring was important in later wells when the lower DDS sensor was damaged. The evidence of torsional vibration in the upper sensors allowed the interference of torsional vibration in the damaged sections of the BHAs. This damage may possibly have been caused by lateral vibration as indicated in Figs. 6 and 8. The realization that the upper sensor could be used to determine probable events and damage to the lower sensor was important on three wells for ChevronTexaco, where DDS tools were damaged and the AGS tools either failed or were severely damaged. Harmonic induced vibration. Presence of the upper DDS sensor generated further information on how the unstabilized sections of the BHA react while drilling certain formations. Traditional BHA modeling of eccentric drillstring rotation is based around pivot points, usually the bit and stabilizers. Therefore, they were of little use in predicting whirl in the un-stabilized sections of the BHA. Whirl analysis for the stabilized BHA section matched recorded DDS data that showed no instances of whirl. The upper DDS data reveals some characteristics of a whirling motion but with a few subtle differences. A traditional response to whirl is high magnitude peak acceleration and medium to high average acceleration. In these wells, the signature was reversed; and, commonly, high average and medium peak accelerations were recorded. Location of the upper DDS sensor may explain this response. Without any discrete components, e.g., stabilizer of bit blades, to create the high peak accelerations, the BHA effectively “rolls around” the borehole wall as it flexes and eccentrically rotates. Whirl is usually initiated by harmonic frequencies that cause the drillstring to eccentrically rotate around a point other than its geometric center. Such eccentric rotation can be set up by critical RPMs generating undesirable frequencies. Within the ChevronTexaco wells, whirl stopped and started without any change in surface drilling parameters. Sandstone effect. The whirl stopping and starting suggested the existence of another influence on initiating the vibration. Plots of the wireline Gamma Ray data (using a sandstone/ shale delimiter of 100 api units) showed a clear relationship between presence of a sandstone formation and initiation of whirl. Therefore, the type of formation was proposed as “the other influence.” Fig. 9 shows the depth plot of the wireline Gamma Ray and the upper DDS sensor with a zero sensor depth offset at Well B. It is clear that whirl was initiated on entering the sandstone formation marked as X1. The figure also shows the initiation of torsional stick-slip vibration marked as X2. The interaction between the two mechanisms of vibration will be discussed later. A similar figure in the original paper, taken from Well C, further shows the direct relationship between sandstone formations and whirl. The two figures also highlight the difference between traditional whirl response and the response shown, namely with high magnitude, average acceleration and medium Peak vibration.
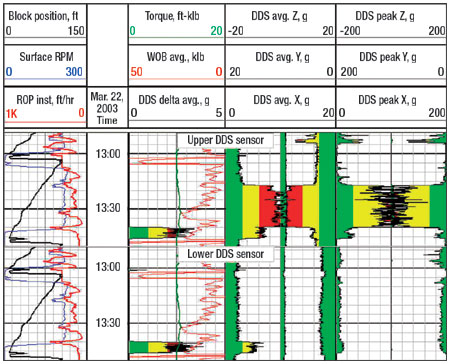
BHA whirl was recorded only in the upper DDS sensor and only while drilling through sandstone formations. There was no correlation between Gamma Ray and upper DDS vibration. Interestingly, the lower sensor never recorded BHA whirl. Lack of BHA whirl in the lower portion of the BHA suggests that stabilizing the lower portion of a BHA had prevented lateral vibrations. Since whirl was recorded only while the bit drilled through sandstone, bit/ formation interaction is clearly shown to initiate the vibration. It further suggests that an undesirable harmonic can be initiated by the cutting action of a bit in sandstone. Observations also indicate that the whirl-causing harmonic frequency is not disrupted by the stabilized portion of a BHA. These frequencies are actually transmitted along the drillstring which caused the BHA to whirl as shown in Fig. 9. Burst frequency analysis. Further analysis of whirl vibration is possible by burst frequency analysis. Burst frequency data is recorded during vibration events. This data can be used to identify the whirl mechanism and other harmonic effects within the BHA. When the frequency data is analyzed, it adds further evidence of harmonic vibration transmission through the drillstring. The burst files from whirl events in the upper sensor identify a possible location for the whirl initiation. It is also interesting to note that burst files from the lower DDS sensor have shown no evidence of whirl in the stabilized BHA section. This observation clearly demonstrates improvements in the design of the BHA for this particular well profile. Burst frequency data from the upper DDS sensor shows two harmonic frequencies. The first indicates bit whirl by presence of low-frequency burst data comparable to an RPM in use at the time of vibration. In wells A, B and C, where upper DDS burst data was available, burst frequency clearly indicates backward bit whirl. It also shows that bit whirl can generate the necessary drillstring harmonic and movement to cause irregular BHA movement at least 850 ft from the bit, therefore inducing BHA whirl. The second harmonic is of a much higher frequency, above 75 Hz. This is recorded in several of the upper DDS burst files from the three wells during periods of vibration. Although this frequency does not indicate specifically bit or BHA whirl, it does demonstrate a harmonic frequency resonating through the drillstring. This frequency has been described as drill pipe “ringing,” wherein the whole string vibrates or resonates in response to vibration. Vibration interaction. This has been examined during data analyses for torsional vibration and whirl. A significant feature is that the two mechanisms of vibration were never seen to take place at the same time, suggesting that one is not a function of the other. There is evidence from Well B and Well C that whirl was present only in sandstone formations and was isolated from stick-slip which, however, was seen while drilling in all types of formations. These observations suggest that the two vibration mechanisms are unrelated in cause. Well B shows how torsional vibration interrupts whirl recorded by the upper DDS sensor, Fig. 10. The upper sensor shows whirl between 13:17 and 13:41, with no recorded vibration during the same period in the lower sensor. With the onset of stick-slip at 13:41, recorded in both sensors, the harmonic frequency required to maintain whirl is broken down due to the uneven drillstring rotation. The evidence of whirl described above suggests that the harmonic frequency generated was a result of the bit-rock interaction and, more specifically, was generated while drilling sandstone. Unfortunately, the generating mechanism for the torsional stick-slip vibration has not yet been fully identified due to a number of unresolved factors.
SUMMARY AND CONCLUSIONS Data from two DDS sensors, with separation of over 800 ft, show clearly that torsional vibration is transmitted along the drillstrings of the study wells with very little attenuation. Transmission with little attenuation is indicated by similar magnitudes of acceleration or downhole RPM. In the slip phase of stick-slip, downhole RPM has been shown to increase to 2 – 2-1/2 times the surface RPM. The lateral shocks associated with stick-slip are most likely responsible for downhole tool and component failures. In addition, high torque in the drillstring during torsional vibration has, very likely, also contributed to the belled boxes found in both HWDP and drill collars. Whirl has been shown to relate to drilling in sandstone (as defined by api units). Here, bit-rock cutting action initiates whirling. The presence of whirl in the HWDP section of the BHA is the first evidence of vibration in an unstabilized section of the BHA. This harmonic is clearly transmitted through the drillstring and takes effect only outside of stabilized BHA sections. Transmission is further identified by burst frequency analysis that demonstrates that bit whirl harmonics are transmitted through a stabilized BHA and are expressed by whirl within upper sections of the BHA. Frequency data also show that drillstring “ringing” or resonance can be transmitted outside stabilized BHA sections. Damage to BHA and drillstring components occurred during drilling of these wells, suggesting also that whirl effects outside the stabilized BHA could be a factor contributing to drill pipe/ drillstring fatigue. Whirl and stick-slip have been shown to be initiated by different mechanisms. When torsional vibration is present, it will likely breakdown whirl vibration. Following the data analyses, several guidelines and recommendations were made to ChevronTexaco to mitigate vibrations. The results have been encouraging as rig repairs for damaged equipment, or for BHA component failure, have not been reported to date. Indications are that significantly lower levels of vibration have been experienced.
|
|||||||||||||||||||||||||||||||||||||||||||||||||


- Coiled tubing drilling’s role in the energy transition (March 2024)
- Advancing offshore decarbonization through electrification of FPSOs (March 2024)
- Subsea technology- Corrosion monitoring: From failure to success (February 2024)
- Using data to create new completion efficiencies (February 2024)
- Digital tool kit enhances real-time decision-making to improve drilling efficiency and performance (February 2024)
- E&P outside the U.S. maintains a disciplined pace (February 2024)
- Applying ultra-deep LWD resistivity technology successfully in a SAGD operation (May 2019)
- Adoption of wireless intelligent completions advances (May 2019)
- Majors double down as takeaway crunch eases (April 2019)
- What’s new in well logging and formation evaluation (April 2019)
- Qualification of a 20,000-psi subsea BOP: A collaborative approach (February 2019)
- ConocoPhillips’ Greg Leveille sees rapid trajectory of technical advancement continuing (February 2019)

