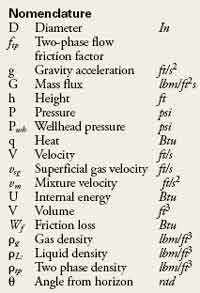
Production Technology
A new approach optimizes continuous gas lift system
Accounting for the composition of the gas matters.
Alireza Bahadori, University of Masjed-Soleiman, Iran; Khalil Zeidani, University Of Alberta, Canada
A simulation with a compositional model, combined with a new optimization algorithm, improved the accuracy of predicting gas-lift performance when compared to a black-oil model. The injection gas source for Aghajari oilfield gas-lift system is supplied from Marun oilfield gas compressor station. Marun's gas is drier and has lower molecular weight than the Aghajari's ultimate tank gas, and it will result in inconsistencies for black-oil models. The black-oil method is fast, but not very accurate when compositional differences must be taken into account.
The compositional modeling employs the Peng Robinson Equation of State for rigorous thermodynamical and physical properties evaluation. From actual pressure and temperature surveys and simulation results, gas-lift performance curves were constructed for an Aghajari field well in different separator pressures. When gas lift is planned, it is even more important from a production standpoint that the separator be operated at the lowest practical pressure.
To evaluate the Aghajari's gas-lift performance, some key parameters in the gas-lift system were compared using both black oil and compositional models and with practical data.
INTRODUCTION
Gas-lift systems have a significant impact on facility processes. High-pressure gas is injected into the well to lighten the fluid column and allow reservoir pressure to force the fluid to surface. The gas that is injected is produced with the reservoir fluid into a low-pressure system. Therefore, the low-pressure separator must have sufficient gas-separation capacity to handle lifting gas as well as formation gas.
If gas lift is to be used, it is very important from a production standpoint that the low-pressure separator be operated at the lowest practical pressure. Surface back-pressure is an important design factor in continuous flow lift. Knowing whether or not the well must be unloaded into the system pressure or into a lower pressure is important in gas-lift design. Horizontal flow correlations should be used to obtain the necessary pressure to produce certain fluid rates from the wellhead to the separator.
As in a flowing well, the variables that affect producing rates in continuous-flow gas lift can be classified into two groups: those which can be controlled and those over which there is little or no control. The first group includes flowline size and length, tubing size and length, surface restrictions and separator pressure. The other group includes fluid properties, reservoir static pressure and the inflow ability or productivity index.
AGHAJARI OIL FIELD
Aghajari oil field was discovered about 70 years ago in southwestern Iran. In the mid-1970s, the peak oil production rate was just above 1 million bopd, and it stabilized around 800,000 bopd for more than 15 years before declining to its present 180,000-bopd rate.
This oil field contains five production units, three NGL plants, three gas compressor stations and a gas-lift ring. The gas-lift ring was installed in 1978, and it distributes the gas between more than 60 wells out of 165 producing wells.
The source of lift gas for this system is Marun oil field. A gas-injection compressor station supplies gases that are drier than the ultimate Aghajari's tank gas. The difference in the composition of lifting gas and associated gas yields inconsistencies in the black-oil simulation model. Figure 1 depicts a schematic of the Aghajari gas-lift system. Most of the wells flow up the annulus of 5- and/or 7-in. liner and 9-5/8-in. casing; lift gas is injected by a 2-7/8-in. diameter tubing string, 6,557 ft in length, which produces well fluids out of the annulus, Fig. 2.
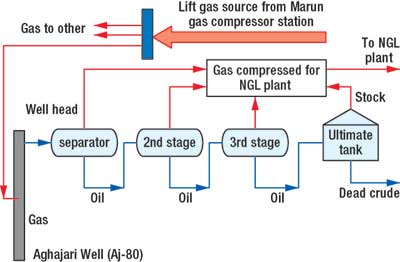 |
Fig. 1. Aghajari gas-lift process schematic.
|
|
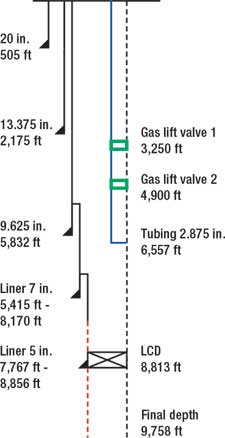 |
Fig. 2. Aghajari Well 80 downhole sketch.
|
|
On the basis of recent studies, Aghajari field reservoir pressure maintenance and use of a gas-lift system are the best mechanisms to improve oil recovery in this field. So, the newly designed project aims to transmit 3 Bcfd of gas from South Pars field to inject in Aghajari field. It is meant to increase the reservoir pressure up to 2,900 psi in the first phase and to 3,600 psi in the second phase of this gas-injection project. The South Pars gas pool is the biggest gas reservoir in the world and is located in the southern part of Persian Gulf. It is shared with neighboring Qatar. Besides the considerable boost in Agharjari's oil output, transferring such gigantic amounts of gas will assure storage of the gas into the central part of the country for future needs.
BLACK OIL MODEL
This model is extensively used. In a Black Oil PVT Model, the fluid is defined in terms of stock tank oil, gas gravities and phase ratios. The fluid properties, as a function of pressure and temperature, may be described using a number of industry standard correlations. In the Black Oil PVT Model, the total volumetric flowrate of each phase in the system is the sum of all the contributions from sources in the system.
Black-oil models assume that the hydrocarbons may be described as two components, oil and gas, and that hydrocarbon-fluid composition remains constant during the simulation. All fluid properties are assumed to be determined by oil pressure and bubble-point pressure only. All mass transfer between the two components is normally described by the solution gas-oil ratio term, Rso, although the oil-in-gas term to handle condensate may easily be included in the black oil formulation1,2,3
To calculate pressure drop, the appropriate correlations for fluid properties and multiphase flow are determined by PVT data. The correlations used for the calculation of fluid properties, such as solution gas-oil ratio, oil formation volume factor, oil viscosity and gas compressibility factor, are given in Table 1.
| TABLE 1. Physical properties correlations.4 |
 |
|
COMPOSITIONAL MODEL
Compositional simulations based on full component flash calculations are time consuming for most applications. One way to speed up the flash calculations, as was done for the Aghajari oilfield gas-lift system, is component lumping, Table 3. In this method, the original components are replaced by a small number of pseudo-components with averaged properties. This will speed up the calculations, but the accuracy of the method will deteriorate when the number of pseudo-components decreases too much. In a compositional fluid description, the fluid is described in terms of components (e.g., C1, C2, H2S), their properties (e.g., molecular weight) and the composition of the fluid. The stock tank oil and gas volumes depend on the separator configuration and, therefore, the stock tank volumetric flowrate of each phase in the system will not necessarily be the sum of the individual contributions from all sources.
| TABLE 3. Fluid compositions used in gas-lift black-oil model. |
 |
|
In light oil reservoirs, hydrocarbon compositions, as well as pressures, affect fluid properties. Equilibrium flash calculations using K values and the Equation of State (EoS) must be used to determine hydrocarbon phase compositions. In a compositional model, in principle, we make mass balances for each hydrocarbon component, such as methane, ethane, propane, etc. In practice, we limit the number of components included and group components into pseudo-components of Mathematical Material. The number of equations that must be solved in compositional simulation depends on the number of components modeled. Often, we model the lighter components individually and group heavier components into a pseudo-component. If non-hydrocarbons are involved, these may have to also be modeled separately.1,5,6 The simulation with compositional model is done with PR EoS in this work.7
 |
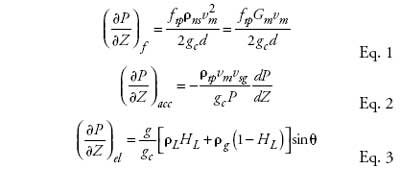
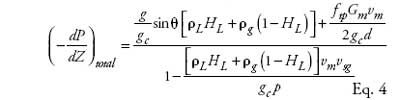
Pressure drop is due to friction loss, acceleration loss, and as elevation change through the piping system. Consideration of the first law of thermodynamics and energy balance between the two-points of fluid flow results in Eq. 1:4,8
Therefore, overall pressure drop will be:
ANALYSIS PROCEDURE
Based on the black oil and compositional models, PIPESIM software7 was used for analyzing production system and determining the vertical multiphase flow pressure drop in the well. The vertical multiphase flow correlation requires the well profile, production rate data and surveys of bottomhole pressure and temperature. After these data were entered into the modeling software, PIPESIM calculated well performance curves for different separator pressures. The calculated well performance results are determined from the pressure traverse with an appropriate multiphase flow correlation.
In the second stage to determine the expected production rates for injected gas rates at various separator pressures, the appropriate fluid property correlations and the appropriate vertical multiphase flow correlations were applied. After determining different wellhead pressures for the well from actual pressure and temperature surveys, some gas-lift performance curves were constructed for the well. To determine the most appropriate way to analyze the performance of the gas-lift system, a comparison between the actual data and results was performed. The average reservoir pressure or bottomhole pressure always remains fixed and does not vary with the flowrate.
Gas lift performance curves were constructed in different separator pressures to analyze the gas lift well's performance. Well profile, production rate data, bottomhole flowing pressure, average reservoir pressure at mid-perforation, and surface gas-lift pressure are needed to optimize the gas lift system. The required input data are shown in Tables 2, and 3.
| TABLE 2. Required data for black-oil model.13 |
 |
|
Production rates, as a function of gas injection rates, were calculated using the appropriate fluid properties prediction models (black oil and compositional) and the vertical multiphase-flow correlation. Optimum well performance is the maximum production rate using minimum injected lifting gas.
Well performance depends on production tubing size and injected gas-lift rate, but the production tubing is already in the well, so its size had to be used in the optimization procedure. The only parameter left for optimization was the injected gas lift rate.
The following steps were applied to determine the gas-injection rate to produce optimum oil rate for various separator pressure,9,10,11,12 on the basis of data from Tables 1, 2 and 3 and proposed algorithm in Fig 3:
- Select the appropriate fluid properties simulation model (black oil or compositional) and multiphase flow correlations.
- Determine a value for separator pressure for a given system.
- Assume values for GOR and oil flowrate in casing.
- Calculate the pressure traverse inside the well casing in formation oil and associated gas.
- Calculate the gas injection rate in well casing from assumed injected gases and separator pressure.
- Change the value of GOR and separator pressure and repeat the calculations from Step 3.
- Construct the performance curve and production rate as a function of injected gas for different separator pressures.
- Determine the optimum production rate and the optimum injected gas from various wellhead separator pressures.
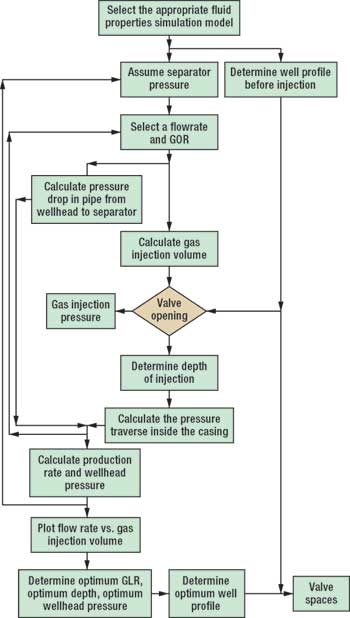 |
Fig. 3. Gas-lift optimization algorithm.
|
|
RESULTS
Figure 4 shows the operating point of Aghajari Well 80. The model results show that if the separator pressure is set to 200 psi and an injection rate of lift gas near 2.4 MMcfd, the well production rate for the black-oil model is about 1,600 bopd, and for a compositional model in the same condition is almost 1,450 bopd, but the actual flow is 1,500 bopd, Table 4. Modeled production rates for various gas-injection rates for both black oil and compositional models are shown in Fig. 4.
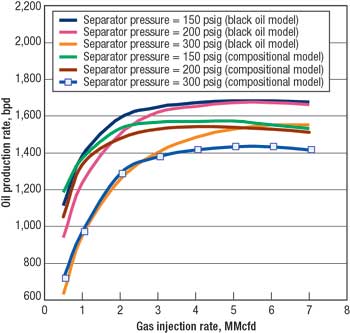 |
Fig. 4. Modeled production rates for various gas-injection rates for both black oil and compositional models.
|
|
| TABLE 4. Compositional model has better results compared to the black oil model and actual production. |
 |
|
Aghajari Well 80 shows a linear relationship between gas injection rate and mixture velocity, across ranges from 0.6 to 5 MMcfd and velocities of 0.5 to 75 ft/sec. However, the black-oil model is always about 8 ft/sec higher than the compositional model for a given separator pressure.
The black-oil model assumes that the hydrocarbons may be described as two components, oil and gas, and that hydrocarbon fluid composition remains constant during the simulation. All fluid properties are assumed to be determined by oil pressure and bubble point pressure only. All mass transfer between the two components is normally described by the solution gas-oil ratio term. The inconsistencies of lift-gas properties (Marun injection gas) with the Aghajari tank gas, makes the differences bigger for high gas-injection rates in both models.
Wellhead temperature and pressure vary with different separator pressures and fluid-package models. The above-mentioned reasons are acceptable for wellhead pressure and temperature performance at high gas-injection rate. Increases in wellhead temperature are caused by reduction in fluid-resistance time in the annulus at a high gas-injection rate, and the slope of the curve decreases because of lower production rates.
Figure 6 indicates that increasing the lifting gas volume from its optimum value does not effect bottomhole pressure. This graph also shows that at higher separator pressure, the required bottomhole pressure will be more for the optimum injected gas and production rate, Fig. 5.
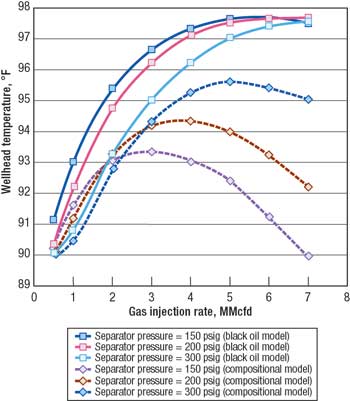 |
Fig. 5. Wellhead temperature varies with injection rate.
|
|
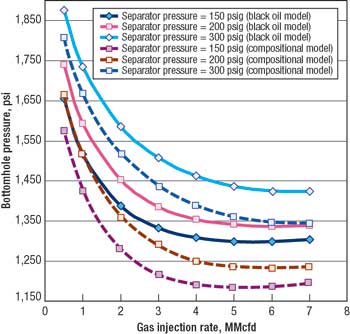 |
Fig. 6. Aghajari Well 80 bottomhole pressure in different wellhead separator pressures and models.
|
|
From all of above, it can be seen that black-oil method is fast, but not very accurate when compositional differences must be taken into account. This is especially true in the model when the injection gases are drier than the ultimate tank gas, and will result in inconsistencies in the model. The black-oil model assumes that the light component is identical to the tank gas, while the heavy component is identical to the tank oil. The difference between the black-oil and compositional models seems, at first glance, not so great, but the difference plays an important role when different compositions are mixed. When mixing two components that have a different tank-gas or tank-oil composition, inconsistencies will be introduced when using the black-oil model. 
ACKNOWLEDGEMENT
The authors thank the Department of Petroleum Engineering at the National Iranian South Oil Company (NISOC) for giving permission to publish this work.
LITERATURE CITED
1 Mattax, C. C. and R. L. Kyte, Reservoir Simulation, SPE Monograph Series, Richardson, Texas, 1990.
2 Skjæveland, S. M. and J. Kleppe, Recent Advances in Improved Oil Recovery Methods for North Sea Sandstone Reservoirs, SPOR Monograph, Norwegian Petroleum Directorate, Stavanger, 1992.
3 Ferrer, A. A. and R. Magglolo, "Use of computerized model in the optimization of continuous gas lift operations," presented at the SPE Production Operations Symposium in Oklahoma City, Oklahoma, April 7 – 9, 1991.
4 Brill, J. P. and H. D. Beggs, "Two phase flow in pipes," Tulsa University, Tulsa, Oklahoma, 1984.
5 Sartisburg, P. E. and J. M. Peden, "Compositional two-phase vertical lift performance modeling of crude oil and retrograde gas-condensate wells," presented at the SPE 62nd Annual Technical Conference and Exhibition in Dallas, Texas, September, 27 – 30, 1987.
6 Palke, M. R. and R. N. Horne, "Nonlinear optimization of well production considering gas lift and phase behaviour," presented at the SPE Production Operations Symposium in Oklahoma City, Oklahoma, Mar. 9 – 11, 1997.
7 PIPESIM User's Guide, Version 1.3, Baker Jardine and Associates, 2001.
8 Brown, K. E., The Technology Of Artificial Lift Method, Vol. 4, Pennwell Publishing Co., Tulsa, Oklahoma, 1984.
9 Bahadori, A. and S. Ayatollahi, M. Moshfeghian, "Simulation and optimization of gas lift," Journal of Petroleum Technology, p. 60, May 2002.
10 Bahadori, A. and S. Ayatollahi, M. Moshfeghian, "Simulation and optimization of a continuous gas lift in the Aghajari oil field," SPE 72169, presented at the SPE Improved Oil Recovery Conference in Kuala Lumpur, October 8 – 9, 2001.
11 Ayatollahi, S. and A. Bahadori, M. Moshfeghian, "Method optimizes Aghajari oil field gas lift," Oil & Gas Journal, May 21, 2001.
12 Ayatollahi S. and S. M. Tauseef, C. Guzman, "Compositional model optimizes gas lift," Oil & Gas Journal, pp. 37 – 42, Jan. 10, 2005.
13 Bahadori, A., "Simulation and optimization of continuous gas lift system in the oil fields," M.Sc. Thesis, Shiraz University, July 2000.
ADDITIONAL REFERENCES
Beggs, H. D. and J. P. Brill, "A study of two-phase flow in inclined pipes," Journal of Petroleum Technology, pp. 607 – 17, May 1973.
Vasquez, M. and H. D. Beggs, "Correlations for fluid physical prediction," Journal of Petroleum Technology, pp. 968-970, June 1980.
Lee, A. L. and M. H. Gonzalez, B. E. Ealin, "The viscosity of natural gases," Journal of Petroleum Technology, 1966.
Abdel-Wally, A. A. and T. A. Darwish, M. El-Naggar, "Study optimizes gas lift in Gulf of Suez field," Oil & Gas Journal, pp. 38 – 44, June 24, 1996.
Aziz, K. and A. Settari, Petroleum Reservoir Simulation, Applied Science Publishers, London, 1979.
Beggs, H. D. and J. P. Brill, "A study of two-phase flow in inclined pipes," Journal of Petroleum Technology, pp. 607 – 17, May 1973.
Vasquez, M. and H. D. Beggs, "Correlations for fluid physical prediction," Journal of Petroleum Technology, pp. 968 – 970, June 1980.
Lee, A. L. and M. H. Gonzalez, B. E. Ealin, "The viscosity of natural gases," Journal of Petroleum Technology, 1966.
Abdel-Wally, A. A. and T. A. Darwish, M. El-Naggar, "Study optimizes gas lift in Gulf of Suez field," Oil & Gas Journal, pp. 38 – 44, June 24, 1996.
Bahadori, A., "Simulation and optimization of continuous gas lift system in the oil fields," M.Sc. Thesis, Shiraz University, July 2000.
Aziz, K. and A. Settari, Petroleum Reservoir Simulation, Applied Science Publishers, London, 1979.
|
THE AUTHORS
|
 |
Alireza Bahadori is a lecturer at the university of Masjed-Soleiman, Iran and a part-time researcher with NISOC. His expertise includes artificial lift design and production optimization. Bahadori earned a technical diploma in control instrument services from NIOC's technical school in Aghajari, in 1991, a BSc in chemical engineering from the Petroleum University of Technology, Iran, in 1998, and an MSc in chemical engineering from the University of Shiraz, Iran, in 2000. Bahadori is a member of Iranian association of chemical and petroleum engineers. bahadori.a@nisoc.com
|
|
 |
Khalil Zeidani is a PhD candidate in petroleum engineering at the University of Alberta, Edmonton, Canada. He earned his ME in reservoir engineering from the University of Calgary, Canada, in 2002 and his BSc in chemical engineering from Petroleum University of Technology of Iran in 1998. He also holds a Diploma in Control Instrument Services (CIS) from NIOC's Technical School. Previously, he worked four years as a CIS technologist and three years as a process engineer for the NIOC.
|
|
|