|
Vol. 227 No. 9 |
| |
 |
Flow assurance requires specific design
A comprehensive approach with a field’s unique characteristics in mind overcomes temperature challenges.
Mark Utgard, AMEC Paragon, Houston, and Jean-Francois Saint-Marcoux, Acergy, Houston
An accurate flow assurance method requires a comprehensive look at the entire field life and changing reservoir forecasts, suggesting that customized solutions are more reliable than a generic approach. This case history addresses thermal issues encountered during the detailed design of a deepwater field offshore West Africa. The technical solutions proposed along with the detail and final design decisions made by the operating company are explored.
FIELD LAYOUT AND ISSUES
The field is in 1,200 – 1,600 m water depth and is produced through two drill centers (DC). Water is injected at one end of the reservoir and gas is injected at the other, presenting a wide range of fluid properties to consider. Each DC has two daisy-chained manifolds connected to six wells. The production is extracted through two 10-in. flowlines and processed to a host facility midway between the DCs. A 6-in. test line extends from each DC’s manifold to the host.
Subsea tiebacks in deep water pose an operability risk due to thermal issues and potential hydrate formation. These ice-like formations can accumulate and impede or block fluid flow. This can result in weeks of lost production and revenue or even force flowline abandonment.
Detailed design must consider the full range of operational scenarios and produced fluids to insure reliability. Comprehensive flow assurance studies are required to insure that hydrate formation conditions do not develop and lead to a line plug during all system operation modes. Furthermore, long industry lead time for specialized equipment and pipe influences the process. Since the pipe and major equipment is ordered prior to detail engineering, the detail design needs to compensate for restrictions or limitations of the equipment.
In deepwater designs, flow assurance analysis is critical to identify fluid characteristic or flowrate changes that may result, if the ordered equipment does not meet expectations. To make the equipment work properly, flow assurance must determine changes in equipment or expected/ normal operating procedures.
FLUID TYPES
Cool-down issues need to be considered across all aspects of a field’s life. This can be challenging with reservoir forecast changes and outlook optimization, which can radically alter produced-fluid characterization. The design in this situation needed to accommodate a wide spectrum of fluid properties. Water and gas injection can further complicate flow assurance studies, if the gas- or water-injection field locations change during the design process.
The operator provided a production forecast for each of the field’s wells, which detailed the amount of expected oil, gas and water over a 25-yr period. There were 375 different production rate sets with different fluid compositions. Each production year for each well was plotted on a graph showing water cut (WC) versus gas to liquid ratio (G/L). Fig. 1. Using this graph, points were chosen that encompassed the range of G/L and WC, while paying special attention to higher production rates (larger bubbles).
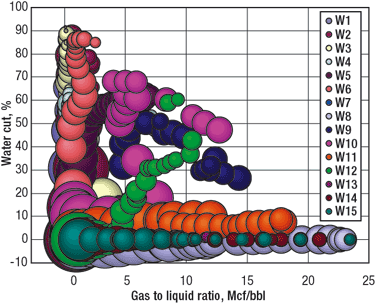 |
Fig. 1. Each production year for each well was plotted showing the range of fluids present.
|
|
The operator’s reservoir models predicted the influx of water and gas in the well fluid, and therefore WC ranges of 0 to 85% and G/L ranges from 0 to 24 Mcf/bbl were forecasted. The range of fluid properties of the selected fluids should be robust, so that, if the forecast changes, a complete re-study will not be needed. However, should major changes occur in the design (such as different gas/ water injection philosophy or additional tie-backs to a DC) the forecast may change significantly requiring additional studies.
A similar approach was taken for the production flowline analysis. The operator provided a 25-yr production forecast for each of the four flowlines. Over a 25-yr period, there could be 100 different production rates with different fluid compositions. Once the best production forecast and fluid composition data were identified, points were again plotted. PVTSim and OLGA software processed the data and generated fluid property tables referenced in the decision-making process.
Fluid-type selection is critical for wells and flowlines. It allows the thermal study to focus on a limited number of cases, while modeling the total operation over the field’s life. Capacity (steady state) calculations can be completed for all fluid types in the forecast, but thermal calculation using transient software are time consuming and should focus on a few fluids. Time limits do not permit detailed flow assurance thermal studies for all possible fluid types. Therefore, the selected fluid types should provide sufficient information to understand the forecast’s boundaries.
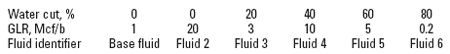
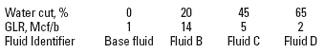
Furthermore, the forecast will change as it is optimized or once production data is available. The selected fluid properties should anticipate a range of fluids that can be adapted to a new optimized forecast, Table 1 and Table 2. The base fluid is the expected produced fluid in the first production years, when production peaks.
| TABLE 1. Well fluids |
 |
|
| TABLE 2. Flowline fluids |
 |
|
A SIMPLE SOLUTION
Addressing in-flow temperature at the host facility was a primary challenge early in the process. To meet the oil specifications, the fluids from the two DCs had to arrive at the host facility at a sufficiently high temperature. Mid- and late-life years barely met the specified temperature. Several options were considered:
- Modify the host facility’s process for a lower arrival temperature
- Increase flowline insulation
- Heat the well fluid upon arrival
- Mix the DC well streams
- Produce the less-prolific DC through a single flowline, rather than two.
Attention was given to the two options that required less system design modification: producing through one flowline or modifying the host facility’s production manifold. Producing the less prolific DC through a single flowline was adequate, but it created hydrate mitigation problems during shutdown, due to cold, dead oil in the unused flowline.
To resolve the large, fluid-temperature differentials from the four production lines at the host facility, attention turned to altering the production manifold. The well-fluid arrival temperature from the less prolific DC was low; but, the arrival temperature of the well-fluid from the other DC remained very high, Fig 2.
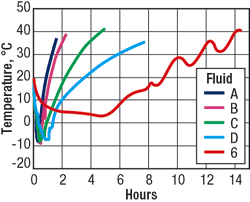 |
Fig. 2. Arrival temperature from the less prolific DC was low, but the other DC’s temperatures remained high.
|
|
In the original design, the production manifold did not allow production mixing from the four flowlines. Changing the production platform manifold design to insure mixing, balanced the production temperatures and eliminated an expensive heater addition, Fig 3. The flow assurance analysis revealed that mixing the flow at the production manifold had a positive impact throughout the field’s life and generated a more cost-effective and appropriate solution, Fig 4.
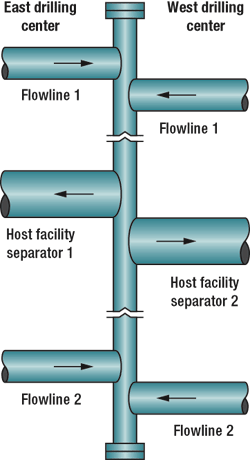 |
Fig. 3. Changing the production platform manifold design ensured fluid mixing, which balanced temperatures.
|
|
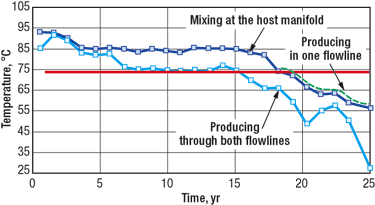 |
Fig. 4. Flow assurance analysis revealed that temperature mixing at the production manifold had a positive impact.
|
|
HYDRATE MITIGATION
Having resolved the steady-state, thermal, arrival-temperature issue, the next consideration was avoiding hydrate conditions during all operational modes. Startup and restart conditions received special consideration. The flow assurance analysis identified a mid- to late-life problem that required operational guideline changes.
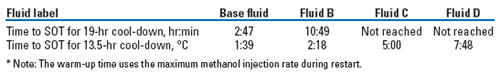
Under initial operating conditions, the production flowlines were designed for a cool-down time of 19 hr. This mandated primary hydrate mitigation using methanol injection during restart until the production rate met the 19-hr cool-down limit. This approach required:
- A four-hour, no-touch period
- A four-hour, light-touch: inhibitor injection via the wellhead, well jumpers, manifolds and flowline jumpers
- A four-hour period to displace well fluid in both test lines with dry oil
- A seven-hour period to displace the well fluid in the four production lines.
During the initial phase of a cold startup, the wellstream had to be inhibited. Methanol injection was maintained until the production rate was high enough that the system reached a Safe Operating Temperature (SOT). SOT is the wellstream temperature measured upon arrival at the host facility at which the required cool-down time is reached. In this case, when 55UC SOT was reached, the system would have 19 hr of cool-down time. However, because the flow assurance study revealed a high water-cut later in the field’s life, the available methanol system flowrate and storage was not adequate.
Since the methanol injection system was designed prior to the detailed engineering phase, changes to the methanol injection/ storage system could not be easily accommodated. Therefore, an alternative was required.
The approach chosen was to reduce shut-down time. This ensured that the flowrate would increase fast enough to warm the system to the SOT and provide the reduced cool-down time.
Revised operational guidelines were created to ensure that hydrate mitigation procedures could be completed in a shorter time. To reduce the cool-down time, the operator permitted startup of one side of the field first, eliminating the need to displace both flowlines and the test line in the other drill center, if startup issues arose. As a result, the cool-down time for the first DC to be displaced was reduced from 19 hr to 13.5 hr, Table 3.
| TABLE 3. Safe operating temperature cool-down for different fluids. |
 |
|
It should be noted that the test line lengthens the displacement time and complexity of the system, and as a result, has prompted industry experiments with subsea flowmeters, as an alternative.
COLD SPOTS
When operating in deep water, production systems are exposed to low ambient temperatures and points within the system are at risk for cold spots: points cooling more quickly than the rest of the system after shutdown. A cold spot typically exists at a high point in the production system where gas gathers, where insulation is lacking, or a combination of the two. With transient, multi-phase simulator software, only cool-down times in regular, circular, insulated pipes are usually analyzed. Therefore, a finite-element, thermal software is required for complex geometry cold spots.
Once the hydraulic software provides initial temperature and fluid properties, the cool-down time of the cold spot can be assessed by developing a finite element model of the cold spot geometry (a connector, a valve with actuator, an anchor flange connected to a stab-in system). Systus software was used to determine the area affected by hydrate and the exposure duration upon restart, Fig 5.
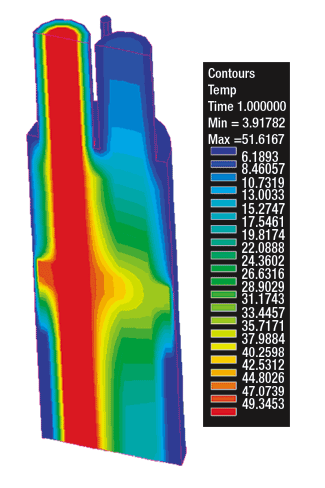 |
Fig. 5. The cool-down time of the cold spot can be assessed by developing a model of the cold spot geometry.
|
|
Once cold spots are identified, addressing them begins. In some cases, operators have more than one option and, based on operating philosophy, may accept or reject a solution. This depends on the level of risk with a given option.
This system had a cold spot at a subsea joint between a jumper and tool connection. The insulation around the jumper was too thick to allow the connector running tool to go around it, so the amount of insulation had to be reduced. Interestingly, the flow assurance analysis revealed that, while hydrates could form, they would not block the line.1
The hydrate size calculation considered that all hydrates cages were occupied and that the water molecule to hydrocarbon molecule ratio was between 5.6 and 5.8. This provides a method of calculating the hydrate volume that may form on restart, based on the known amount of water. Still, the operator opted for a conservative retrofit of the connection and the addition of a dog-house to stabilize the temperature and prevent hydrate formation.
The second cold spot was located at a high point in the riser system close to the host facility. Because hydrate remediation measures could be implemented from the facility without mobilizing a service vessel, the operator determined this cold spot did not pose a threat.
It is not surprising that the operator chose to insulate the deepwater cold spot between the jumper and tool connection, even though engineering calculations showed the risk of hydrate blockage was minimal. The risk of hydrate formation for deepwater fields is very real and production losses are a real threat to profitability. Deepwater fields typically are strong producers and are very profitable; therefore, risks that could cause production losses are minimized. However, as deepwater fields become smaller and less profitable, operators may accept more risks to reduce capital expenditures, if calculations show that hydrate potential is minimal or almost non-existent.
SUMMARY
The results of this project were favorable, as no major changes to pipe and equipment insulation design were required. Where pipe or equipment design failed to meet expectation, flow assurance provided reasonable operational guidelines to insure hydrate-free operation.
Within the industry there exists a desire to standardize host facilities. As demonstrated in this project, even when the equipment is designed for a given field, there are significant field-design challenges to overcome in detail design. If the equipment is designed for a generic field, fitting a design to a specific project may be very difficult and require major changes. 
LITERATURE CITED
1 Notz, P. K., S. B. Bumgardner, B. D. Schaneman, and J. L. Todd, “Applications of kinetic inhibitors to gas hydrates problems,” SPE Production and Facilities, November 1966.
THE AUTHORS
|
 |
Mark Utgard is manager of flow assurance at AMEC Paragon in Houston. He has extensive flow assurance experience in deepwater field development and design. Utgard earned a BS degree in engineering from Baylor University and an MS degree in mechanical engineering from Rice University.
|
|
 |
Jean-Francois Saint-Marcoux is the group conceptual engineering manager for Acergy in Houston. He is in charge of early project studies and has worked in the offshore industry for the 30 years with a focus on deepwater and subsea. Saint-Marcoux earned an MS degree in mechanical engineering from California Institute of Technology and a PhD in physical oceanography from University of Paris IV.
|
| |
|
|

