RESERVOIR
CHARACTERIZATION
Characterizing fracture and matrix heterogeneities
in tight gas fields
Flow
simulations using discrete fracture network models and
full-field continuum modeling helped explain extremely variable
well performance in the Waterton complex, Western Canada.
Keith Rawnsley,
Martin de Keijzer, Lingli Wei, Solenn Bettembourg, Wenche Asyee,
Jose-LuisMassaferro* and Peter Swaby, Shell E&P; Donna
Drysdale and Dan Boettcher, Shell Canada Ltd.
Well performance is extremely variable in the stacked sequence of
tight Devonian and Mississippian carbonates in the northern part of
the Waterton complex of Alberta, Canada, despite an extensive fracture
system present in all the wells. To determine why some wells penetrated
more permeable fractures than others, a full reinterpretation of the
geophysical, structural, stress, matrix and dynamic data sets was carried
out at West Carbondale field in the complex. Flow simulations at sector
scales using discrete fracture network models and full-field continuum
modeling were used to test a range of geological and dynamic scenarios.
For this field, the best-fit dynamic models consist of a major fracture
zone, corresponding to either a seismic scale lineament or zone of
enhanced curvature, trending through the area of most prolific wells.
Outside this zone, the vast majority of the fracture system makes little
contribution to flow in the wells.
BACKGROUND
The Waterton gas fields in southern Alberta
represent the largest gas accumulations operated by Shell in the
Canadian foothills. Gas is contained in a series of northwest-southeast-trending
anticlinal structures within an imbricate stack of thrust sheets,
Fig. 1.
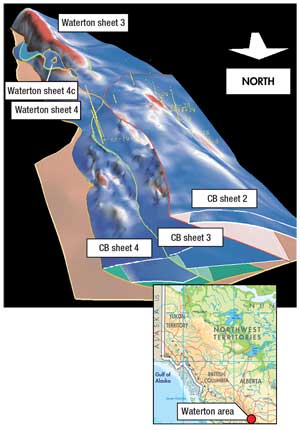
|
| Fig.
1. An imbricate stacked thrust sequence of Devonian
and Mississippian carbonates forms the Waterton complex.
The surfaces are colored with hot colors corresponding
to the most highly curved areas. In the distance the
southernmost anticline is Waterton field proper. It is
the largest, highest, most curved and most productive
structure. West Carbondale field is labeled CB sheet
3. Castle River is marked CR sheet 4. The field of view
is 15 km east-west and 40 km north-south. |
|
The Waterton duplex developed as a result of thin-skinned thrusting
and folding during the Laramide orogeny, which occurred from Middle
Jurassic to Paleogene time.1
Prior to the study, north- to north-by-northeast-trending fractures
were determined to be associated with mud losses and therefore important
for flow. Consequently, horizontal wells in West Carbondale and Castle
River were drilled in the structural highs parallel to the crests of
the anticlines, aiming to intersect many N-trending fractures. In West
Carbondale (Fig. 2), vertical wells and horizontal sidetracks penetrate
the West Carbondale Sheet III Devonian structure. Each of these wells,
taking into account sample bias due to different well orientations,
intersected a broadly similar high number of fractures (hundreds over
a 1-km interval). The dynamic response, however, was extremely heterogeneous,
with well test permeabilities varying by over three orders of magnitude.
Thus, the challenge in these fields is not simply to intersect fractures,
which are present wherever drilled, but to intersect productive fractures.
|
| Fig.
2. Well locations and main production results
of the West Carbondale structure. Root mean square amplitude
seismic background shows lineaments. |
|
Devonian and Mississippian carbonates form the main reservoirs. Porosity
in the carbonates is low, rarely exceeding 6%. Matrix permeability
is correspondingly low (0.1 mD) and well productivity depends on the
intersection of open fractures. The North Waterton fields, such as
West and East Carbondale and Castle River, contain leaner gas, and
production in these areas is hindered by elemental sulfur dropout.
Depletion drive is the principal recovery process. Aquifer support
is generally weak.
The objectives of the study were:
- To identify those reservoir
parameters that control the short- and long-term productivity of
existing wells
- To provide reservoir models
that more accurately predict productivity for new wells and that
assess the impact of the main risks within a range of uncertainties
- To provide recommendations
for narrowing uncertainties and improving well success through such
means as data acquisition and improved well design.
- Key parameters of the matrix and fractures were incorporated and tested
against dynamic data to recognize the main uncertainties for the Waterton
field.
MATRIX CHARACTERIZATION
To provide a framework for the reservoir modeling and fracture analysis,
a detailed core study was conducted, both for the fractures and for
the matrix. The result of the matrix study revealed the internal architecture
of the main reservoir zone, the Crossfield Member, Fig. 3.
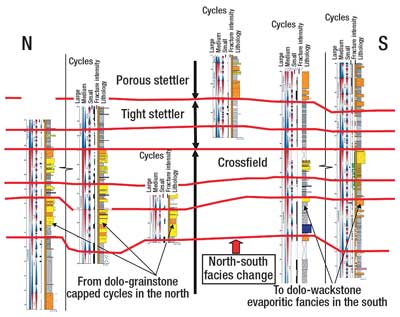
|
| Fig.
3. Sequence stratigraphy framework of North
Waterton. Each cored well is represented by sequence
stratigraphy columns on the left, with red triangles
representing regressive deposition and blue triangles
representing transgressive deposition. Three orders of
sea-level cyclicity are shown with increased resolution
to the right of each figure. On the right a facies log
is drawn, with increasing grain size to the right from
dolo-mudstone (grey), dolo-wackestone (orange), dolo-grainstone
(yellow) and dolo-boundstone (blue). The red lines crossing
between the wells represent the boundaries of the main
geological units used in the area. |
|
Although completely dolomotized, the reservoir could be subdivided
into genetically related cycles. This allowed improved correlation
of facies and petrophysical properties in each cycle and, in particular,
identified a northward improvement of dolo-grainstone-capped cycles
toward the north of the field in thin higher porosity layers.
Based on core measurements, the grainstones have average porosity
values of 5%, the packstones and wackestones 3% and 2%, respectively,
and the mudstones 0.5%. Other property values were also tested in simulation,
as discussed below.
SEISMIC FAULT ANALYSIS
The main objective of the seismic evaluation was the visualization
and definition of subtle features in the field that could be used to
explain the difference in well behavior. The complex geological setting
(large horizontal and vertical velocity contrasts) and the high mountains
(terrain effects) make seismic acquisition and processing a challenge.
Before any interpretation was carried out on the seismic volume, a
structural oriented noise filter was applied to allow smoothly picking
events that served as the base for attribute mapping.
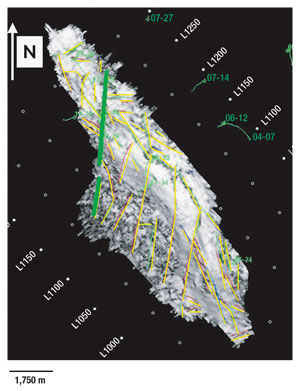
The resulting interpreted lineaments consist
of mainly NNE-SSW-
and NNW-SSE-trending lineaments, Fig. 4. One feature, the “main
lineament,” was consistently present on all the attributes, striking
NNE-SSW. This lineament intersects the area of the best producer,
CB3-09, and can be seen in the background of Fig. 2.
|
| Fig.
4.
Interpreted lineaments from multi-attribute picking of
the West Carbondale structure. The “main
lineament,” which was present on all attributes,
is shown in green. The faint green lines are the well
trajectories. |
|
Despite the existence of these lineaments in the seismic data, the
poor seismic quality prevented definite confirmation that these are
not seismic artifacts.
FRACTURE CHARACTERIZATION
Fracturing, as interpreted from borehole images, is intense throughout
West Carbondale. Typically, multiple fractures are intersected per
meter by the horizontal wells, and multiple fracture orientations point
to a geometrically well-connected fracture system, Fig. 5. The most
productive well, CB3-09, is not the most intensely fractured.
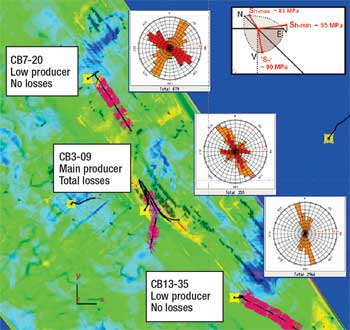
|
| Fig.
5. Fracture data, stress interpretation and
top structure map from the central area of West Carbondale.
On the top map, hot colors correspond to the most highly
curved areas. |
|
The seismic top map in the vicinity of
CB3-09 appears to be more disturbed with both axial parallel and
north-south-trending “escarpments.”
Curvature analysis of the top structure map shows that this well is
located in the area of highest curvature when compared with the less
productive wells to the north and south. Fractures sub-parallel to
the crest of the anticline are present in all the wells.
Because all the wells are positioned in or near the crest, it is not
possible to determine if the axial parallel fractures are also present
away from the crest. In both core and borehole images the presence
of fractures was noted in all lithologies. In the core, all of which
is from vertical wells, a slight increase in fracture frequency could
be noted in the finer lithologies, mostly associated with small, closely
spaced, cemented fractures. A fracture frequency track is displayed
in Fig. 3. No clear relationship was observed with bed thickness. Borehole
image data was compared with the loss zones during drilling. Despite
large numbers of electrically conductive fractures, only a small subset
of these corresponds to losses.
The effective fracture permeability and any variation between layers
are explored further in the reservoir engineering history matching,
described below.
IN SITU STRESS ANALYSIS
An evaluation of the in situ stress field using the borehole image
and caliper data set was conducted. The key results (Fig. 5 inset)
suggest that the maximum horizontal stress is oriented NNE, which is
parallel to the main lineament trend. The in-situ stress field may
provide information as to which structures may be expected to be preferentially
reactivated and/or opened up, and to have enhanced permeability.
ANALOG CONSTRAINTS
To better understand the spatial distribution,
structural styles and scales of fractures and faults, an analog outcrop
study was initiated in the Sawtooth Range, northern Montana. The
Montana outcrops have a comparable stratigraphy and structural setting,
with Mississippian and Devonian carbonate rocks comprising a regional
duplex of imbricate thrust faults and thrust-related anticlines.2
Various compressional anticlines were examined, including the Swift
Anticline. The Swift Anticline is a kink- or chevron-type fold, with
a relatively narrow (about 20-30 m) hinge zone, a shallow dipping backlimb (about
8-15° WSW), and a steeply dipping forelimb (ENE-dipping 70-85°).
A combination of helicopter and ground-based photography enabled mapping
of a wide variety of fracture scales. In all parts of the fold, fractures
occur, including dip parallel, axial parallel and oblique. In the forelimb,
the fractures are locally reactivated with shear displacements. Localized
zones of intense fracturing occur in the oblique lineaments at a range
of scales. There is also intense axial fracturing in the hinge zone.
As an analog outcrop, the Swift Anticline has provided valuable information
supplementing the limited subsurface data in terms of geometry and
connectivity; types and scales of fractures and faults; and the geometric
evolution, reactivation and resulting fracture patterns.
INCORPORATING PRESSURE TRANSIENT DATA IN SECTOR MODELS
Five wells in West Carbondale have been
tested for flow after drilling. These wells are, from north to south:
CB7-20, CB11-09, CB3-09 (horizontal sidetrack of 11-09), CB7-03 and
CB13-35 (horizontal sidetrack of 7-03). Some wells have repeated
pressure buildup tests after production was started. The test results
from West Carbondale (Fig. 6) show more than three orders of magnitude
of average permeability variation over the total gross reservoir
thickness, which is similar across the structure. Combined with the
fact that none of the well tests shows simple radial homogeneous
flow, the West Carbondale structure can be called “extremely
heterogeneous” in terms of flowing features.
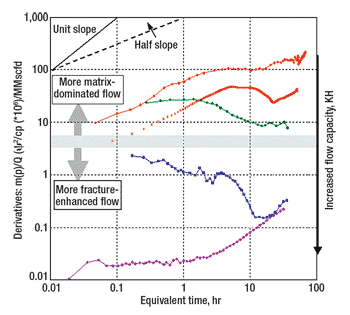
|
| Fig.
6. Comparative plot of the pressure derivative
curves of all well tests from West Carbondale. The color
of each curve corresponds to the well. Orange = CB7-03
(in the south of the field), green = CB7-20 (in the north),
blue = 3-09 area vertical well (center of field) and
pink = CB3-09 horizontal well. The blue and pink curves
meet at a later time as they have the same reservoir
volume. |
|
Other than CB11-09 and 3-09, the tests
were consistent with background matrix permeability. To better assess
the consistency of the fracture description work in terms of well
test responses, discrete fracture models were built and then transferred
to the single-phase flow simulator MaficOil, where simulations were
carried out to test different scenarios and assess those fractures
that were effectively flowing in the reservoir. From the study of
log images, mud loss data and regional geology, fracture sets were
created, Fig. 7. In all, five different sets of fractures were generated.
The first three sets were generated from the image analysis, and
the two remaining sets were generated from the seismic attribute
map at the scale of the seismic lineaments.3 By simulating well tests
with different combinations of fracture sets and comparing the simulation
results with the actual well test data, the seismic scale features
were found to be the conductive features at Well CB3-09. In these
models, the well is crossing a “fault zone,” modeled
as a finite-length fracture that intersects the well. This model provides
the best fit for CB3-09, Fig. 7 inset. The “steep” slope
at late time in the derivative is explained by the fact that the well
sees the end of the fracture zone. The orientation of the fault zone
could not be determined from the well test simulation, and although
illustrated to be parallel to the main lineament, equally good fits
can be obtained with the fracture zone parallel to the crest, or any
other orientation. Most conclusively, the surrounding fractures are
contributing significantly less to the well test response.
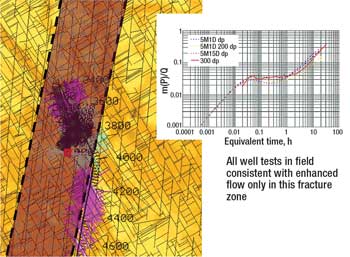
|
| Fig.
7. Detail of the discrete fracture model built
for West Carbondale. The fracture pattern is based on
the sector scale fractures seen in both the outcrops
and borehole image data. The pressure transient data
(inset) has been simulated in the models. |
|
It was concluded from this phase of the
study that the major contribution to flow in the wells was linked
mostly to large-scale features, either corresponding to the seismic
lineaments or to zones of highest curvature and enhanced fracture
flow properties. From this perspective, the key uncertainty-and opportunity-was
to determine which of the mapped seismic lineaments or curvature
zones could also contribute to flow, other than those at CB3-09.
FULL-FIELD SIMULATION
To further address the question of which large scale features in the
field could be contributing to flow, and how much contribution was
coming from the smaller scale fractures and matrix, the full 20 years
of production and pressure data were also analyzed and used to constrain
the reservoir modeling.
The pressure history measured from static pressure gradient measurements,
pressure buildup tests and interference data from 1979 to 2001 is summarized
in Fig. 8. Of particular interest is the pressure response to production
from CB3-09. The well to the north sees relatively good communication
(as recorded by a downhole pressure gauge), whereas the well to south
sees little pressure decline.
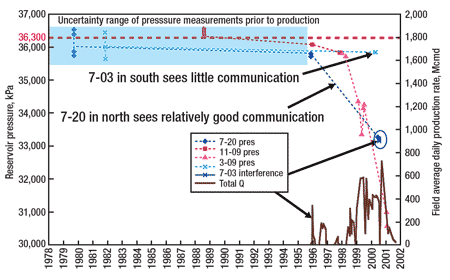
|
| Fig.
8. The pressure history measured from static
pressure gradient measurements, pressure buildup tests
and interference data from 1979 to 2001. The well to
the north sees relatively good communication with 3-09
whereas the well to south sees little pressure decline. |
|
In the simulation models, the reservoir is modeled in terms of matrix
and fractures. Small-scale fractures (including micro-fractures) are
regarded as part of the matrix, and the highly permeable fracture zones
are represented explicitly in the dynamic models. A geological scenario
for each run contains three components: a matrix porosity model, a
matrix permeability model and a fracture zone model. Each component
has several alternative models. Each geological scenario is formed
from different combinations of these components.
The matrix model has 20 layers following
the small-scale cyclicity. Each layer has up-scaled porosities based
on the facies porosities given in the “matrix characterization” section above, with
sensitivities around these. The main north-south facies trend
is reflected in the model.
The matrix permeability model assumes
no poroperm relationship, and that the matrix permeability is approximately
that determined from the matrix support in the transient pressure
analysis. It is a bulk value comprised of the matrix and any small-scale
fracture enhancement. In the north of the field, the bulk “effective” matrix
permeability was given a value of 5 mD; in the center 1 mD was used
and in the south 0.05 mD, with sensitivities around these, Fig. 9.
The history matching suggests that there is no strong variation in
effective matrix permeability between the layers.
|
| Fig.
9. An overview of the scenarios studied. The
fracture zone models are derived from the learnings from
the reservoir data evaluation, the outcrop studies and
the well test simulation results. A number of scenarios
were generated to capture and test the range of possibilities.
Good fits could be obtained with fracture zones of limited
extent in the area of the most prolific wells, models
2 and 3. |
|
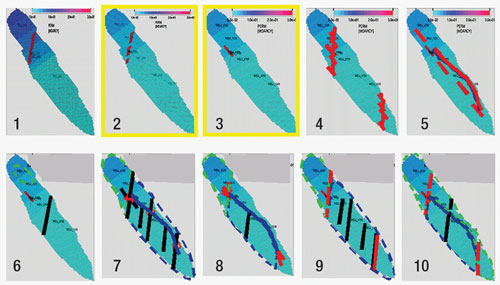
Figure 9 shows an overview of the fracture scenarios studied. Red
lines are high permeability, blue lines are moderate permeability and
black lines are barriers. The fracture zone models are derived from
the reservoir data evaluation; the outcrop studies and the well test
simulation results. A number of scenarios were generated to capture
and test the range of possibilities.
Model 1: Main lineament continuous. This model assesses the possibility
that only the main lineament is significantly more permeable (14 mD
from well test results) than the rest of the reservoir. Smaller structures/seismic
zones such as the north-trending seismic fault intersected by CB13-35
are considered ineffective for flow, and are included in the matrix/background
permeability.
Model 2: Main lineament discontinuous. The primary difference is that
in model 2, the main lineament is assumed to be hydraulically discontinuous/compartmentalized
(not necessarily, but possibly also geometrically). This scenario is
considered because: (a) the main lineament appears in the seismic data
to consist of smaller, discrete seismic discontinuities of various
orientations, some of which appear disconnected; and (b) the productive
fracture zone has limited size (about 200 m) as constrained from well
test analyses and simulation.
Model 3: Hinge-parallel fault
of limited extent/curvature. Model 3 also assesses a single high-permeability
zone of limited lateral extent in the CB3-09 area, this time trending
320° (well
tests do not provide information on direction). This direction also
coincides with seismic discontinuities. No significant contribution
to flow from the main lineament is assumed.
Model 4: Discontinuous high-permeability
zones of variable orientation in the CB3-09 area. Model 4 is a variation on models 2 and 3. Model
4 most closely reproduces the more complex fault interpretation shown
in Fig. 3 and is characterized by a higher density of laterally restricted
seismic disturbance zones trending northwest (i.e., axially), north
and east in the CB3-09 area and to the northeast.
Model 5: Axial thrust and disconnected
320° fracture
zones. In this model, the potential importance of the axial thrust
is considered (not only its northern tip, as potentially in model
3). Structures in other directions are included in the background
permeability.
Model 6: Curvature and barrier. Model 6 is similar to model 3, and
tests a curvature dependency on well deliverability. It assumes no
contribution from potential fracture/fault zones outside the strongest
curved area, elongated parallel to the hinge (the curvature is shown
colored in Fig. 5). A sealing fault barrier (black feature) is placed
across the center of the field to test sensitivity to pressure response.
Model 7: Fracture-enhanced productivity
at major fault intersections only. This model addresses the concept that significantly enhanced
permeability is obtained only at or near the intersection of two or
more large faults. A large fault structure by itself is assumed to
be ineffective for flow. An example of this could be the north-trending
seismic fault (zone) intersected by CB13-35, which did not cause any
mud losses. Permeability enhancement can result from increased connectivity
within the intersecting fault damage zones, with or without increased
fracturing. All the seismic lineaments are represented in this model.
Other models. In model 8, the axial thrust has permeable damage zones
at either end. In model 9 the main lineaments flow while smaller lineaments
are barriers. Model 10 features an axial thrust connecting two flowing
lineaments and crossing through a barrier.
RESULTS
The history matching is most sensitive to the gas volume in the model
stored in the matrix porosity and the permeability contrast between
the north, center and south of the field. Although it is less sensitive
to the details of the fracture models, it can be said that for a fracture
model to be consistent with all the available dynamic data, it must
possess the following attributes:
- A large but finite-length
fracture zone (high permeability) in the vicinity of CB11-09 and
intersecting CB3-09, Fig. 9
- The entire field, from north to south, must be in the
same “compartment,” i.e., no sealing faults (this does
not exclude faults acting as “baffles”). The volume of
this compartment is constrained by the dynamic data
- It is unlikely that there
are a large number of well-connected fracture zones with large permeability
such as the one intersecting CB3-09. This is due to the 5-mD upper
limit of the effective permeability in the better part of the reservoir.
In more detail, the models too well connected to the south relative
to the north, or with too much permeability in the south, cause over-depletion
in the southern wells (models 5, 7, 8 and 10). Models with barriers
cause too little depletion in the south (models 6, 7 and 9). Models
with very long permeability zones around the most productive well (CB3-09)
are not consistent with the transient buildup data (models 1 and 4).
Models 2 and 3 provide equally good matches.
Within models 2 and 3, the total production history is well matched,
making them the best fits of all the models. Both have a limited zone
of enhanced fracturing in the 3-09 area. Further encouragement for
the history match comes from more recently acquired pressure measurements
in CB7-09, the sidetrack of 3-09 and CB13-35. The predictions of the
pressures in CB7-09 and CB13-35 at the end of the simulation (Dec.
31, 2001) are consistent with measurements.
CONCLUSIONS: PROSPECT RISKING AND REDUCED UNCERTAINTIES.
A new integrated fracture/matrix model for Devonian sheet III West
Carbondale has been produced that is consistent with the extreme aerial
heterogeneity of well performance. In the model, productive fractures
are defined at the seismic scale, and are limited to a single zone
crossing the CB3-09 area.
One interpretation is that the main lineament controls fracture flow,
primarily because it is aligned with the in situ maximum compressive
horizontal stress. Other areas are dominated by matrix flow. This interpretation
assumes that the seismic lineaments are not artifacts. Alternatively,
fracture flow due to enhanced fracturing in the region depicted by
the high curvature near well CB3-09 is also a possible model.
It is recommended to target intersections
between north-south
lineaments and curvature where it is possible to increase the likelihood
of intersecting flowing fractures. In the north end of sheet III West
Carbondale, no north-south lineaments the size of the main lineament
are present in the seismic, and there are no high-curvature areas comparable
to the CB3-09 area. In the north, targeting the relatively high-porosity
layers (possibly in the Crossfield) may provide the most reliable drilling
strategy provided that the porosity can be found and wells can be made
to produce from the matrix.
Given the remaining uncertainties associated with the quality of seismic
and limited well coverage outside the crestal area, some updating and
refinement of the model is to be expected as future information becomes
available. 
ACKNOWLEDGEMENT
This article was prepared from “Characterizing fracture and
matrix heterogeneities in folded Devonian carbonate thrust sheets,
Waterton tight gas fields, Western Canada,” in Lonergam, L.,
Jolly, R. J. H., Rawnsley, K. and D. J. Sanderson, eds., Fractured
Reservoirs, Geological Society, London, Special Publications, 2007,
pp. 265-279.
LITERATURE CITED
1 Monger, J. W. H., Price,
R. A. and D. J. Tempelman-Kluit, “Tectonic
accretion and the origin of the two major metamorphic and plutonic
welts in the Canadian cordillera,” Geology, 10, 1982, pp. 70-75;
Price, R. A., “Cordilleran tectonics and the evolution of the
western Canada sedimentary basin,” in Mossop, G. and I. Shetsin,
eds., Geological Atlas of the Western Canada Sedimentary Basin, 2nd
ed., Alberta Research Council and Canadian Society of Petroleum Geologists,
Calgary, 1994, pp. 13-24.
2 Bloy,
G. in Structural Style, Sedimentology and Fracture Characterization
of the Castle Reef Fm., Montana, field trip guidebook, Post-4, CSPG-CWLS
Joint Technical Convention, 1995; Boyer, S. E., “Geometric evidence
for synchronous thrusting in the southern Alberta and northwest Montana
thrust belts,” in McClay, K. R., ed., Thrust Tectonics, Chapman & Hall,
London, 1992, pp. 377-390; Holl, J. E. and D. J. Anastasio, “Deformation
of a foreland carbonate thrust system, Sawtooth Range, Montana,” Geological
Society of America Bulletin, 104, 1992, pp. 944-953.
3 The
modeling techniques are based on Rawnsley, K. et al., “New
software tool improves fractured reservoir characterization and modelling
through maximized use of constraints and data integration,” SPE
88785 presented at the Abu Dhabi International Conference and Exhibition,
Abu Dhabi, Oct. 10-13, 2004.
|
THE
AUTHORS |
|
Keith
Rawnsley is a structural
geologist who has focused on fractured reservoir characterization
and modeling. He has a PhD degree in engineering geology
from the University of Leeds, UK, and 17 years’ industry
experience in Elf, BP and Shell since 2000. He is currently
working on a cross posting as the production geologist
for the Qarn Alam steam project within Petroleum Development
Oman. He has worked on fractured and faulted reservoirs
in most major petroleum plays. |
|
|
Martin
de Keijzer joined Shell E&P as a structural geologist in
2000 and has worked on a number of fractured carbonate reservoirs
worldwide, combining research and field development. He is
currently working with Shell for the Nederlandse Aardolie Maatschappij
(NAM) in the Netherlands on a variety of topics, including
reservoir compartmentalization, salt tectonics and drilling
hazards. He has a PhD degree in structural geology from the
University of New Brunswick, Canada. Dr. de Keijzer can be
contacted at m.dekeijzer@shell.com. |
|
|
Lingli
Wei is a reservoir engineer
in Shell International Exploration and Production in The
Netherlands. He earned an MSc in hydraulic engineering
at Tsinghua University, Beijing, in 1988, and a PhD degree
in rock mechanics from Imperial College, London, in 1992.
He has worked primarily on geomechanical and reservoir
engineering aspects of fractured reservoirs. He gained
experience in geotechnical, nuclear waste disposal and
the oil and gas industry working for an international consultancy
company and then BP before joining Shell in 2001. |
|
|
Solenn
Bettembourg earned an MSc degree in applied mathematics and
computer science from the Université Pierre
et Marie Curie, Paris. She joined Shell International E&P
in 1998, and worked as a reservoir engineer on various research
projects focusing on fractured carbonate reservoir characterization.
She has experience in fractured carbonate fields and EOR projects. |
|
|
Wenche
Asyee graduated in 1989
from Utrecht University in the Netherlands with an MSc
degree in structural geology and has worked as a consulting
geoscientist since then. She joined the Shell carbonate
team in 2000, focusing on seismic interpretation (QI, volume
interpretation and visualization) on a large variety of
proven oil and gas carbonate fields worldwide. |
|
|
Peter
Swaby received a first-class
honors degree in mathematics in 1983 and a PhD degree in
computer science in 1987 from the University of Birmingham,
UK. Since then he has spent 20 years in the oil business,
initially for BP, then for Elf/Total and now for Shell. |
|
| |
| |
|


