The new tool helped StatoilHydro place a long horizontal section in a thin reservoir while avoiding an overlying unstable formation.
Michael Bittar, Frode Hveding, Nigel Clegg and Jim Johnston, Sperry Drilling Services; and Gro Mangerøy, StatoilHydro
Drilling through complex reservoirs can be extremely challenging, since pre-well geological models are often limited to the resolution of seismic data. Even with nearby offset wells against which to correlate, complex geology by definition has significant variations that cannot be fully anticipated before drilling. Advances in directional LWD resistivity measurements have compensated for these pre-well limitations through improved real-time geosteering, by providing discrete measurements and distance to the formations above, below and to the sides of the sensor while drilling horizontally or at high-inclination angles through the reservoir.
The new InSite Azimuthal Deep Resistivity (ADR) sensor from Halliburton’s Sperry Drilling Services combines the functions of geosteering and formation evaluation to allow the drilling engineer and the geologist to optimize wellbore placement and reservoir production in highly deviated and horizontal boreholes, especially in complex reservoirs. This functionality was a critical factor in the recent successful placement of a horizontal well section in a thin reservoir for StatoilHydro in the North Sea.
TOOL SPECIFICATIONS
The sensor uses a multi-frequency, deep-reading, azimuthal (directional) resistivity design that incorporates new sensors and tilted receiver coils. Advanced miniaturization techniques improve the sensor’s reliability by reducing the number of components. Increased processor speed and downhole memory improve processing power and accommodate storage of larger data sets, while a new communication protocol increases data transfer rates at the surface. Faster telemetry is achieved through improved data compression and smart downhole processing that determines the best or most critical data to transmit in real time. The telemetry rate can be further enhanced using downlinking from the surface (while on bottom) to change the data stream as desired during drilling, transmitting the most important measurements more frequently and less important data at a slower rate. The LWD tool is also fully compatible with Grant Prideco’s proprietary IntelliServ network, which provides real-time data telemetry at much faster speeds than mud-pulse telemetry through the use of wired pipe.
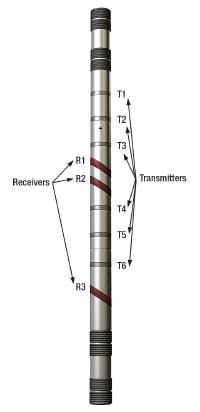
The tool is a single 25-ft (7.6-m) collar that is available in two sizes, 4¾ in. (121 mm) and 6¾ in. (171 mm), to accommodate hole sizes ranging from 5⅞ in. (149 mm) to 10⅝ in. (270 mm). The propagation resistivity sensor consists of six coaxial transmitters and three receiver coils that are tilted at 45°, Fig. 1.
 |
|
Fig. 1. Sperry’s InSite Azimuthal Deep Resistivity (ADR) sensor is comprised of a single collar with six transmitters and three tilted receivers. The tool acquires azimuthal compensated resistivity measurements with different depths of investigation.
|
|
This arrangement provides compensated phase-shift and attenuation resistivity curves with 8-in. (20.5 cm) vertical resolution and 14 depths of investigation, ranging from 16 in. (41 cm) to 18 ft (5.5 m). The tool has three transmitting frequencies: 125 kHz, 500 kHz and 2 MHz.1 As the tool rotates, the resistivity data are acquired and stored in 32 azimuthally oriented bins of 11.25° azimuthal resolution each, corresponding to 32 different directions around the tool. These bins are referenced to either the high side of the borehole or to magnetic north. The sensor also provides horizontal resistivity (Rh), vertical resistivity (Rv) and dip data.
WELL PLACEMENT
Geosteering uses real-time formation evaluation data to actively guide the wellbore trajectory to the target. Conventional LWD wave-propagation tools only acquire an average resistivity from around the borehole without any directional component. In contrast, the ADR tool is directionally sensitive. Combining the tilted antenna design with longer transmitter-to-receiver spacing and a lower operating frequency (125 kHz) allows the sensor to acquire deep-reading directional resistivity up to 18 ft (5.5 m) into the surrounding rock. These readings provide earlier real-time distance and direction to nearby and approaching resistivity contrasts; i.e., bed boundaries or fluid contacts. This information allows the geosteering team to maintain the desired distance from fluid contacts or formation boundaries, resulting in faster, more confident drilling while ensuring the ideal position of the wellbore in the reservoir. Greater accuracy in well placement can significantly increase production while also reducing non-productive time by minimizing the need for geological sidetracks.
Figure 2 shows the modeled resistivity response of a conventional LWD wave-resistivity tool in a 10-Ω-m pay zone sandwiched between two 1-Ω-m conductive shale beds. The top panel shows the well trajectory, and the bottom panel shows the resistivity response. The lack of azimuthal sensitivity in conventional LWD resistivity tools results in the same resistivity reading whether the tool approaches the conductive shale from the top or bottom. The inability to identify directional differences makes geosteering in the pay zone unpredictable and risky.
In contrast, Fig. 3 shows the modeled resistivity response of the azimuthal sensor for a similar scenario to that shown in Fig. 2. In this example, the top panel shows the well trajectory, the middle panel shows the high-side (top quadrant) and low-side (bottom quadrant) resistivities, and the bottom panel shows the directional geosteering signal, or “geosignal.” The geosignal is calculated from the azimuthal sensor’s different directional measurements and accounts for the difference between measurements from opposite azimuthal orientations. It is used to calculate distance and direction to bed boundaries and also provides the earliest warning of approaching changes because of the very long transmitter-to-receiver spacing.
 |
|
Fig. 2. A model of a conventional LWD resistivity response. The top graph shows the well trajectory, and the bottom graph shows the computed resistivity response of a 10-Ω-m pay zone sandwiched between two 1-Ω-m conductive shale beds.
|
|
Similar to the conventional LWD tool in Fig. 2, the azimuthal sensor reads lower resistivity as the sensor approaches the lower conductive shale. However, in this case the low-side resistivity measurement (i.e., bin 15 of the 32 data bins, indicated by the blue line in the center panel of Fig. 3) reads a much lower resistivity, indicating that the tool is approaching a conductive bed from the bottom of the pay zone. As the tool approaches the shale from the top of the pay zone, the high-side resistivity measurement (i.e., bin 0, indicated by the red line in the center panel of Fig. 3) reads a lower resistivity, indicating that the tool is approaching the shale from the top of the pay zone. Similarly, the directional geosignal decreases as the tool approaches the conductive boundary from the bottom of the pay zone and increases as the tool approaches the conductive boundary from the top of the pay zone.
 |
|
Fig. 3. The azimuthal sensor’s resistivity response is shown for a similar scenario to that shown in Fig. 2. Here the resistivity of the two bounding shale beds is 2 Ω-m. The upper panel shows the well trajectory, the center panel shows the high-side (red) and low-side (blue) resistivity, and the lower panel shows the directional geosteering signal or “geosignal,” a dimensionless quantity that takes into account the differences between measurements from opposite azimuthal orientations.
|
|
Based on the same simple model, Fig. 4 illustrates how images generated from the azimuthal resistivity and geosteering data clearly indicate the direction of penetration (entry and exit) of the pay zone. The middle panel shows the modeled resistivity image based on the geological model in the top panel. The image is a 2D representation of the 3D borehole that has been split down the top of the hole and laid flat. The top and bottom of the track represent the top of the high-angle or horizontal hole (or the reference magnetic compass direction), while the middle of the track represents the low side of the borehole (or opposite direction). Drilling from left to right, crossing over from the middle 10-Ω-m formation into the 2-Ω-m shale, the low resistivity in the lowest zone shows up in the bottom readings first, in the center of the image (at about 340 ft in the vertical section) and then eventually at the top and bottom of the image, representing the top of the hole. From this the drillers know that they are going down into the low-resistivity formation. As the tool transitions back up from the 2-Ω-m formation into the 10-Ω-m formation, the readings appear first at the top of the hole, indicating the formation is above the tool. With conventional LWD resistivity tools, the readings would be affected by the adjacent bed but there would be no way to conclusively determine whether the bed was above or below the tool.
 |
|
Fig. 4. The azimuthal sensor resistivity image (middle) and geosignal image (bottom) are shown for the model well trajectory (top).
|
|
FORMATION EVALUATION
The multiple depths of investigation and multi-frequency operation of the azimuthal sensor provide many more measurements than conventional tools, about 1,300 measurements per depth station. Compensating the received signal provides a more accurate determination of formation resistivity in any direction. Combining the compensated with the uncompensated data enhances the anisotropy effect at a lower relative angle.
Conventional induction-type resistivity tools have traditionally used coaxial receivers, which were originally designed for logging horizontal reservoirs in vertical boreholes. However, in deviated and horizontal wells, reservoir anisotropy and dip can adversely affect the resistivity measurements. To address this challenge, the industry has begun incorporating transverse or tilted (i.e., non-coaxial) coils in both wireline and LWD devices to measure dip effects and anisotropy. The tilted-antenna configuration used in Sperry’s tool has a greater sensitivity to formation anisotropy than conventional coaxial tools, and this allows real-time determination of Rh and Rv; i.e. formation anisotropy, dip angle and azimuth.2
The high-frequency, short-spacing resistivity measurements are used to map the near-wellbore properties. The longer-spacing and lower-frequency measurements are used to characterize the uninvaded zone deeper into the formation. The ability to directionally map these data around the borehole and at different depths of investigation provides more robust estimates of invasion profiling and anisotropy. Robust fast-inversion methods simultaneously determine Rh, Rv and relative dip angle. The transmitter/receiver array also generates multiple resistivity images that allow detailed 3D characterization of the near-borehole environment; e.g., fracture/fault direction, dip direction and angle. Compared with traditional imaging tools, the multiple depths of the azimuthal measurements extend the sensitivity range from several inches to several feet into the formation.
The geosteering team can choose the most appropriate individual resistivity value “bin” or group of bins for evaluating different parts of the reservoir, or an average resistivity value can be generated for correlation with conventional data. Extensive tool-response characterization has shown that the ADR tool can be used both as a conventional LWD device and as an advanced resistivity and well placement tool.1 This eliminates the need for running two separate tools to address both geosteering needs and data requirements for advanced petrophysical analysis.
NORTH SEA WELL PLACEMENT
On a recent well in the Oseberg area drilled for StatoilHydro, the azimuthal sensor was used to precisely place a long horizontal section through the reservoir while avoiding an overlying unstable formation. The target reservoir consisted of a series of sands with interbedded silts, bounded above by an unstable coal and below by a silt unit. The sand units were about 2 m thick and showed some lateral variation, which had an impact on the measured resistivity values. To make geosteering decisions with confidence, it was important to identify and track the boundaries of these sand units to ensure that the well path remained in the most productive parts of the formation. To accomplish this, seven resistivity curves were pulsed in real time to the surface:
- Three average resistivity measurements (a measurement of resistivity all around the tool) at deep, medium and shallow depths of investigation
- Four azimuthal resistivity measurements consisting of one deep reading and one shallow reading each from the up and down octants.
Based on the average resistivity values, the deepest resistivity measurements had an estimated depth of investigation of 2 m-2.5 m. In the existing formation, with its interbedded sands and silts of 2 m-3 m in thickness, this depth of investigation was ideal. A deeper depth of investigation would not help to geosteer the well path through the formation. This depth of investigation allowed the sensor to see both the upper and lower boundaries of the sands, making it possible to steer between these boundaries.
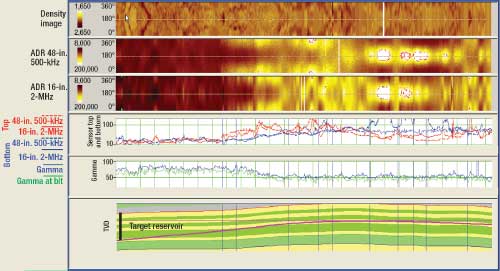
The azimuthal resistivity data, along with gamma ray data, azimuthal gamma ray data at the bit, neutron porosity and azimuthal density, were correlated against offset well data using Sperry’s proprietary StrataSteer 3D geosteering service, Fig. 5. As part of the service, geosteering specialists produce and continuously update the geological model based on seismic surface data, offset log data and the real-time well data.
 |
|
Fig. 5. An interpreted geological model based on azimuthal sensor data in the North Sea well drilled for StatoilHydro. The bottom panel (Track 1) displays the interpreted geology and the actual wellbore. Track 2 shows the gamma ray data at bit in green and the gamma from a separate gamma ray further back in the BHA in blue. Track 3 contains the azimuthal sensor’s top and bottom octant resistivities for the 16-in. spacing, 2-MHz phase measurement and for the 48-in. spacing, 500-kHz phase measurement. This data was available in real time to determine the direction of changing resistivity. Tracks 4 and 5 contain the recorded 32-bin resistivity images from the 16-in., 2-MHz and 48-in., 500-kHz phase measurements. Track 6 contains the image log from the density tool. Using real-time or recorded data, the relationship of the tool to the reservoir can be clearly delineated. A close match between modeled and measured data increases confidence in the interpretation.
|
|
After entering the reservoir through the silt at the base, the well was drilled up through the lower part of the reservoir. The lower part of the reservoir contained a high portion of silt. Offset wells indicated that the more productive sand zones were higher in the stratigraphy; the well was drilled up through the stratigraphy to aim for these sands. As the first sand unit was approached from below, the sensor’s “Deep, Up” reading showed an increase in resistivity associated with the oil-filled sand. This was eventually also reflected by an increase in the “Deep, Average” resistivity. The effect on the azimuthal resistivity was much clearer because of the distinct contrast between the Deep, Up reading and the Deep, Down reading, which showed only the low-resistivity silt that surrounded the tool. As the drillstring approached the sand, first the Deep, Up and then the Shallow, Up readings continued to separate from the Deep, Down and Shallow, Down readings. By modeling this separation, the dip of the formation was estimated and it was determined that unless inclination was changed, the well would rapidly drill through the sand into the next silt unit above. By decreasing inclination, the well was brought parallel to the formation dip. As the well drilled up into the sand, the bottom sensor octants began to reflect the increased resistivity of the sand. A decrease in the Deep, Up resistivity indicated the approach of the well to the silt above; likewise, a decrease in the Deep, Bottom resistivity indicated that the well was approaching the lower silt. These resistivity changes were then used to maintain the well within the sand.
TVD constraints due to an expected coal prevented continuous geosteering to remain in the sand, but throughout the well the azimuthal sensor and the geosteering model were used to identify the approach of the sand units and, where possible, to maximize the footage in the highest-productivity sand.
CONCLUSION
The azimuthal sensor allowed the geosteering team to geosteer a difficult North Sea well based on direct resistivity measurements as well as on resistivity variations. The tool demonstrated the ability to delineate multiple layers and provide early warning of approaching bed boundaries. When combined with well-steering software, the tool was shown to dramatically improve the accuracy of the near-wellbore geological model, making future well planning significantly more effective. Furthermore, the sensor’s tilt-coil configuration provides advanced formation evaluation capabilities that allow petrophysicists to more accurately evaluate reservoirs and reserves. 
LITERATURE CITED
1 Bittar, M. et al., “A new azimuthal deep-reading resistivity tool for geosteering and advanced formation evaluation,” SPE 109971 presented at the SPE Annual Technical Conference and Exhibition, Anaheim, Calif., Nov. 11-14, 2007.
2 Bittar, M., ”Electromagnetic wave resistivity tool having a tilted antenna for determining the horizontal and vertical resistivities and relative dip angle in anisotropic earth formations,” United State Patent No. 6,163,155, 2000.
|
THE AUTHORS
|
|
|
Michael Bittar is a technology fellow and Houston research director for Halliburton. He earned BS, MS and PhD degrees in electrical engineering at the University of Houston in 1983, 1986 and 1990, respectively. Dr. Bittar joined Halliburton through Sperry-Sun Drilling Services in 1990. He has contributed to the advancement of logging while drilling and wireline resistivity logging sensor technology and interpretation, most recently as sensor physics manager for Sperry Drilling Services and Wireline and Perforating Services. Dr. Bittar led the team that developed the InSite ADR sensor. He has more than 20 patents and more than 20 publications and is a member of the Society of Petrophysicists and Well Log Analysts (SPWLA) and the Society of Petroleum Engineers (SPE). In 2006, Dr. Bittar received the 2006 SPWLA Technical Achievement Award.
|
|
| |
Frode Hveding is product champion for resistivity sensors in the Sperry Drilling Services global team in Houston. He holds an MS degree in petroleum technology from the Norwegian University of Science and Technology. He started his career in the oil industry in 1995 as a logging engineer for Western Atlas and later worked for Saga Petroleum as a petrophysicist. Frode joined Halliburton in 2000 as a petrophysicist for Sperry Drilling Services in Norway and focused on Sperry’s BAT (Bi-modal AcousTic) sonic tool. Since then, he has served as regional petrophysical manager and as a technical expert on Sperry LWD technology for internal training and business development.
|
|
| |
Nigel Clegg is Sperry Drilling Services’ team leader for geosteering operations in Norway. He holds a BSc in environmental sciences and a PhD in geology from the University of East Anglia in the UK. Dr. Clegg began his career in the oil industry in 1996 as a logging geologist for Sperry in Norway. In 1997 he became a data engineer working both offshore and in real-time operations onshore. In 2003, he started work as a geosteering engineer for Halliburton in the Norway district and supporting global operations. He moved to his current position in early 2007.
|
|
| |
Jim Johnston is a lead geosteering engineer in the Sperry Drilling Services team in Norway. He holds a BSc in applied science-geology from Kingston Polytechnic in UK. Jim began his career in the oil industry in 1994 as a logging geologist for Halliburton in West Africa. He transferred to Norway as a data engineer in 2001 and began work as a geosteering engineer in 2006. Since then he has worked as a geosteering engineer globally, contributing to the interpretation of InSite ADR tool responses.
|
|
| |
Gro Mangerøy is a senior geophysicist in StatoilHydro’s Petroleum Technology section at Oseberg. She earned a Candidata Scientiarum degree from the Institute of Solid Earth Physics at the University of Bergen, and joined Norsk Hydro (now StatoilHydro) in 1991.
|
|
|


