In a recent Shell study, automatic rig-activity detection was shown to yield cost and time savings on both deepwater and land wells.
Eric van Oort and Ed Taylor, Shell; Gerhard Thonhauser and Eric Maidla, Thonhauser GmbH
Because invisible lost time represents about 30% of the time and cost of well delivery in most drilling operations, Automatic Rig-Activity Detection (ARAD) is a highly significant and exciting new enabler for driving drilling performance improvement. With NOC and IOC drilling budgets now running to billions of dollars, a deeper understanding of invisible lost time presents a historic cost-savings opportunity at a time of rapidly escalating operating costs. A recent Shell study demonstrates that the tools for doing this effectively are now becoming available. They include real-time rig activity detection, either used as a stand-alone technology or in combination with operations monitoring in the setting of a real-time operations center.
BACKGROUND
Historically, well-drilling performance improvement initiatives have focused primarily on Non-Productive Time (NPT) caused by largely unforeseen events (e.g., tool failures, hole problems). With NPT estimates typically on the order of 15-25% of overall well-delivery time for such highly expensive projects as deepwater wells, this area represents a compelling opportunity to pursue. There is, however, an even greater prize in the form of Invisible Lost Time (ILT) on wells ranging from low-cost land wells to deepwater exploration wells.1
ILT quantifies the degree of inefficiency that is absorbed by a well delivery operation. Simply put, although there is no downtime, ILT accumulates if rig operations are not carried out as efficiently as they could be with available technology and best-practice know-how. Adopting the mindset framed by Shell’s proprietary “Drilling the Limit” working practice, ILT can be seen as the difference between the “technical limit” or “drilling the well on paper” time and actual well delivery time.
In the world of real-time Automatic Rig-Activity Detection (ARAD), the drilling process is seen as an industrial manufacturing process with the final product being a well. Many common drilling operations are sequential and can therefore be quantified in time. Of course, this has always been a possibility using stopwatches and dedicated personnel on the rig. The repetitive nature of this work and the relatively poor use of resources that it entailed, however, cried out for a more effective automated solution. This solution became available using patented technology that automatically detects and measures the time taken by the most common drilling operations over the duration of a well drilling operation.2,3
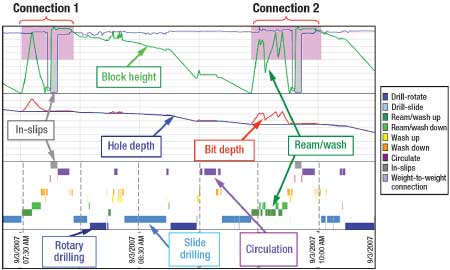
Using high-quality surface data with an appropriately high sampling rate (between 1 second and 10 seconds per data point3), the time taken by various common drilling operations can now be detected: drilling in the rotary mode, sliding, tripping in/out, wellbore treatment time (reaming up, reaming down, washing up, washing down, circulating) and slip-to-slip connection times, Fig. 1. With this characterization, it becomes possible to determine how efficiently these operations are carried out and how much variation each activity shows over time. Benchmarking becomes possible comparing rig to rig, well to well, crew to crew, and even driller to driller. The objective is not to hold specific individuals accountable. Instead, it is to identify best practices, increase transparency, and start the discussion on how to best tackle an evident improvement opportunity given any identified discrepancies in performance. Note that such a discussion is always necessary, as there may be very valid reasons as to why such discrepancies occur (e.g., two rigs dealing with different hardware configurations). The discussion presents a first and important step in effectively addressing ILT.
 |
|
Fig. 1. Graphical illustration of how ARAD identifies and assigns different types of drilling activities.
|
|
To explore the opportunity presented by real-time rig activity detection, a trial in three phases was organized in Shell’s Real-Time Operations Center (RTOC) hubs in the Americas. The first two phases were dedicated to proof of concept, ironing out IT-related problems and developing a “commercial” solution that could be easily implemented for any type of well. The third phase involved the application of this, now mature, solution for a variety of wells. In the following, a comprehensive overview is given of 1) the process of data measurement and analysis, and 2) an overview of characteristic results generated to date.
THE PROCESS
A first and crucial step in the ARAD process is to perform an objective quality check on the data, independent from the party providing this data. This step directly affects the quality of the analysis and the usefulness of the results. Moreover, occasional quality checks need to continue throughout the detection process to make sure that rig sensors remain calibrated and to guarantee that only high-quality data that meets minimum conforming standards is processed by the ARAD calculating routines.3
Aside from its quality, it is important that the data be gathered and transmitted at an appropriate sampling frequency. Since rig activities are analyzed in the time domain, data frequency becomes an important parameter, particularly when carrying out velocity and acceleration calculations; e.g., during trips. Although calculations can still be carried out beyond the low data frequency of 0.1 Hz (i.e., 10-second intervals between successive data points), the accuracy of analyses starts to deteriorate significantly. For optimal results, a frequency of 1 Hz (i.e., 1-second intervals) is recommended and was used during the Shell trials.
In these trials, two main mechanisms were used to process the data. For land wells, the 1-Hz data was gathered by a third-party data provider and sent through a satellite connection to an internet FTP site. It was then downloaded and analyzed by the ARAD service provider at an offsite location in Austria. Standard reports were then communicated via regular email links to the Shell RTOC hubs in the Americas. For offshore wells, high-frequency data was gathered by a third-party data provider at the offshore locations and sent directly to the RTOC hubs by satellite connection, where the data was processed using the real-time version of the ARAD calculating routines. In both cases, use was made of highly skilled personnel with considerable ARAD experience to interpret the data and generate the necessary graphs and reports. Optimization staff associated with the RTOC hubs then analyzed the results and communicated them to operational staff in the field, with particular emphasis on evident opportunities for ILT reduction.
RESULTS IN DEEPWATER WELLS
The ARAD software was used to track the progress of the initial batch set operation of an ultra-deepwater development (water depth of 8,900-9,500 ft) in the Gulf of Mexico on a daily basis. This batch set included a series of 22 largely identical operations (jetting a 36-ft conductor, drilling a 26-in. surface hole, setting a 22-in. casing, drilling a 20-in. hole and setting a 16-in. casing) using the same rig and crews. The total operations time was tracked, and, additionally, specific operations-such as average time in slips during connections, tripping times, circulation times, wash and ream times, rotating and sliding drilling ROP-were tracked to identify and highlight performance opportunities that would help accelerate progression on the learning curve.
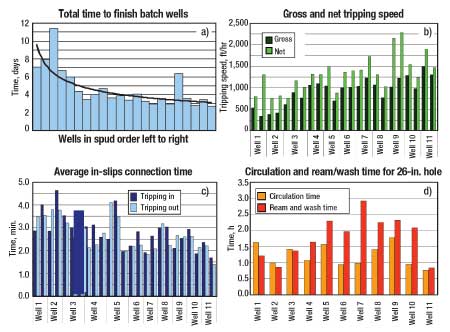
The total operational time for each batch-set well was seen to improve incrementally as the batch sets were drilled, with the most dramatic improvement in the learning curve occurring over the course of the first seven wells, Fig. 2a. Most of the early learning involved solving mechanical issues with the newly constructed rig system, but after the first three wells, the reduction in total well time was due mainly to improvements in operational efficiencies.
 |
|
Fig. 2. Operation time-tracking charts of ultra-deepwater well data produced from ARAD software; a) total-time learning curve; b) gross and net tripping speed; c) average in-slips connection time; d) circulation and ream/wash time.
|
|
Figure 2b shows the total gross tripping speed (total trip depth divided by total trip time) and net tripping time (total trip depth divided by total string-running time plus connection time) for the first 11 wells of the batch set. This clearly shows that the overall tripping speed was incrementally being improved as the wells were drilled, suggesting that the crews were becoming more efficient at the tripping process.
Drilling down into the automated operations recognition data, it was possible to track improvements in tripping at the sub-operational level. Fig. 2c shows that the average time spent in slips while tripping in and out of the hole was reduced as the batch wells were drilled, which was a contributing factor in the increases seen in overall tripping speed. In addition to the average in-slips time, the average individual stand-tripping time and the duration of weight-to-weight drilling connections were also monitored to track operational efficiencies as the batch project progressed. The time spent circulating the wellbore, reaming and washing were also tracked, which highlighted the increase in the amount of wellbore conditioning that was being done while fighting problems of high effective circulating density encountered while drilling the first 10 batch sets, Fig. 2d.
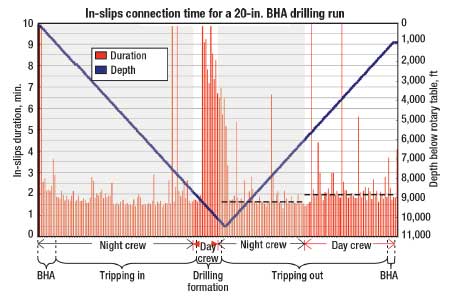
In addition to tracking average times for various tripping parameters, ARAD allowed for a detailed review of individual trip performance histories. Figure 3 shows a trip-history view of the in-slips connection times for an entire drilling BHA run for a well in the 20-in. hole section. Each bar shows the duration in minutes of an individual in-slips event, including the making up of the BHA, the trip in, drilling the formation and the trip out of the hole, with the blue line indicating the depth at which the connection was made.
Viewing the connection data from a trip-history perspective was a useful way of analyzing the tripping efficiency of an individual BHA run, and was used to spot trends and possible areas for improvement. For the BHA run shown in Fig. 3, both the night and day crews were involved, with the night crew on the trip in, the day crew involved with the drilling of the new formation and both crews on the trip out. Since both the day and night crews worked about 50% of the trip out, it was possible to compare the average in-slips time before and after the shift change, to see if there were any operational differences between the crews on the same trip. In this particular case, the in-slips time data shows a discernable difference in the average time (indicated by the dashed black line on the graph) between the two crews. This suggests that the night crew was more efficient in this aspect of the operation.
 |
|
Fig. 3. Trip-history plot of in-slips connection time for a 20-in. drilling run showing individual in-slips durations (red bars) and the depth at which the connection was made (blue line), with the operations and crews indicated along the x-axis.
|
|
The same type of plot was also used to view the trip history of stand-tripping times, casing-running times and weight-to-weight drilling connections. Of course, this type of interpretation must take into account any external factors, such as weather and equipment problems that may have occurred at the time of the crew change. The ability to compare crew performance was recognized as a valuable tool to identify and help crews standardize the use of best practices.
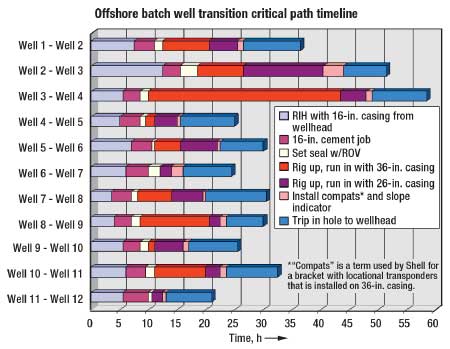
The ARAD data was also used to help track the critical path time more precisely for the transition between the individual batch wells. The rig drilling these wells used a dual-derrick system to achieve a near-continuous operation, where the forward derrick was used to jet the conductor and drill the 26-in. and 20-in. hole sections, and the aft derrick was alternatively used to run the 22-in. and 16-in. casing strings. It was known from the onset that a crucial portion of the operational critical path would be the period starting when the 16-in. casing running string was pulled from the wellhead with the aft derrick at the end of a batch well and ending when the forward derrick had rigged up and run the 36-in. × 26-in. conductor/drilling assembly to the wellhead. Therefore, this portion of the critical path was monitored as the batch set progressed, to see what learning was occurring and what the opportunities were for reducing this well transition time.
Figure 4 shows a timeline plot of the critical path time during well transitions for the first 11 wells. The operational time, combined with the daily operations reporting, was used to define the operational boundaries more precisely for the well-transition critical path and was useful in tracking and helping recognize opportunities, which resulted in an incremental reduction of this transition time as the successive batch wells were drilled.
 |
|
Fig. 4. Timeline plot of the well-to-well transition critical path time for the first 11 ultra-deepwater batch set wells.
|
|
RESULTS IN LAND WELLS
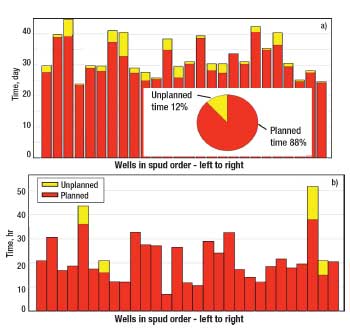
The ARAD approach was also used to analyze sensor data collected on a daily basis from wells drilled by six rigs in Wyoming in conjunction with analysis of data from more conventional sources (e.g., the daily drilling report). At the beginning of the analysis project, a “flat time” (time not directly measurable by mud-logging rig sensors) overview analysis was done of operations data using standard morning operation reporting data from 26 wells drilled during the previous 12 months. The purpose of this was to get a field-level overview of the visible and invisible NPT and areas for potential operational improvements.
The average reported “visible” NPT per well was 12% of the total well time, Fig. 5a. Major contributors to this visible lost time were determined to be mechanical repairs, downhole tool failures, tight hole and well control problems. In addition to identifying the visible NPT, comparative plots of other “flat time” operations-including casing cementing time, BOP nippling-up and testing time, and rig repair and maintenance time-were made to find operational differences between rigs and to investigate areas for potential improvement. One result of this study was confirmation of a wide range in the time for nippling up and testing the BOPs among the six rigs, Fig. 5b. Individual rigs consistently took twice as long as other rigs. This prompted a field investigation, which revealed that structural differences on the individual rigs and BOP equipment were the principal reason for the wide differences in the rigs’ BOP operational times. The operational times for these rigs might be improved, but could never equalize due to these structural differences; nonetheless, knowledge of these differences can be important when decisions are made either to bring a particular rig under contract or to upgrade a rig.
 |
|
Fig. 5. Comparative plots a) of total “planned” and “unplanned” operational time and b) of BOP nipple-up and testing time for Wyoming land wells.
|
|
Mud-logging sensor-derived data was collected on a daily basis from the six selected rigs. Rig data was processed with the ARAD operations recognition software for tracking and benchmarking analysis and to identify potential areas for operational improvement. Summary reports were produced at the end of the 8.5-in. and 6-in. phases and at the end of the overall operation and were made available to the office- and field-based engineers working in the region. Because of the relatively low-visible NPT experienced in the field area, the main foci of the study were to track and benchmark operational times and to investigate potential reductions of “hidden” ILT, by increasing drilling and tripping operational efficiencies from crew to crew, from well to well, and among the six rigs studied. Operational parameters that were tracked included total well and phase times, rotating and sliding ROP, wellbore conditioning time and tripping time. The operations recognition proved to be useful to track whether new bits and drilling technologies being employed were improving ROPs on a well-by-well and on a field-wide basis.
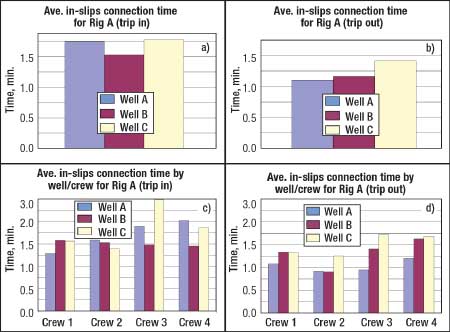
Of particular interest was the ability to use the ARAD data to analyze operation performance per crew both on an individual rig basis and between rigs on a field-wide basis. An example of this is given in Fig. 6, which shows a series of plots for a selected rig showing the average in-slips connection time for three consecutively drilled wells. Figures 6a and 6b show the average in-slips time for trips in and trips out of the hole plotted on a per-well basis, and Figs. 6c and 6d show the same data plotted on a per-crew basis. Whereas the per-well plots indicate some differences between the wells, only when the data was analyzed on the crew level did it become apparent that Crew 1 and Crew 2 outperformed Crew 3 and Crew 4 for this series of wells for average in-slips connection time. Parallel plots made for average tripping stand time and weight-to-weight drilling connection time for these crews confirmed that the same crews were consistently underperforming in these other tripping operations, as well. Even when the average ROPs were compared for a similar hole section, the same performance difference was found between the crews on the rig.
 |
|
Fig. 6. Differences in crew connection performance on three consecutive Wyoming land wells drilled by the same rig.
|
|
These crew-based operational performance comparisons were useful to identify the best-performing crews, to establish “best practice” rig crew benchmarks and to indicate where best to focus training and crew supervision efforts in the future. This type of analysis was of value particularly in situations where new personnel were starting on a rig and in analyzing the effects of periods of high crew turnover on operations efficiency. Requests by the rig engineers for “spot checks” on individual BHA runs were also found useful in some cases to compare crew performance.
CONCLUSION
The ARAD approach proved to be highly useful not only to document learning curves, but also to identify sources of Invisible Lost Time (ILT) and address these in a dialogue with operational field staff. ARAD analysis is seen as a significant and exciting new enabler to drive drilling performance improvement, given that ILT represents on the order of 30% of well delivery time and cost on most drilling operations. 
ACKNOWLEDGEMENTS
The authors thank Mike Crumrine and Nnamdi Abolo for their valuable help and input, and Shell E&P for granting permission to publish this paper.
LITERATURE CITED
1 Bond, D. F., Scott, P. W., Page, P. E. and T. M. Windham, “Step change improvement and high rate learning are delivered by targeting technical limits on sub-sea wells,” SPE 35077 presented at the IADC/SPE Drilling Conference, New Orleans, March 12-15, 1996.
2 Thonhauser, G., Wallnoefer, G., Mathis, W. and J. Ettl, “Use of real-time rig sensor data to improve daily drilling reporting, benchmarking and planning: A case study,” SPE 99880 presented at the SPE Intelligent Energy Conference and Exhibition, Amsterdam, April 11-13, 2006.
3 Mathis, W. and G. Thonhauser, “Mastering real-time data quality control: How to measure and manage the quality of (rig) sensor data,” SPE 107567 presented at the SPE/IADC Middle East Drilling Technology Conference & Exhibition, Cairo, Oct. 22-24, 2007.
|
THE AUTHOR
|
|
|
Eric van Oort earned his PhD in chemical physics in 1991, and joined Shell Research in The Hague in 1992 to work on shale stability problems and drilling fluid design. He moved to Houston in 1996 to lead the global borehole stability team. Subsequently, he led the fluids team and the Real-Time Operations Center (RTOC) hubs for Shell E&P Americas. He currently serves on the Americas Wells Leadership Team as its planning and business improvement manager.
|
|
| |
Edward C. Taylor began his career with Shell E&P in 1984, working offshore on one of Shell’s owned and operated drilling rigs. He graduated from Nicholls State University in 1986, earning a BS degree in petroleum technology. His focus then shifted to the implementation and support of Shell’s offshore drilling software systems. Since 2006, Mr. Taylor has focused on drilling optimization initiatives, including the real-time Automatic Rig Activity Detection (ARAD) project.
|
|
| |
Gerhard Thonhauser holds the chair of Drilling Engineering at the University of Leoben, Austria. Since 1999, he has also served the petroleum industry with drilling data management and engineering services through Thonhauser Data Engineering GmbH. TDE specializes in the collection, quality control and processing of drilling data, particularly rig sensor data. Mr. Thonhauser can be contacted at gerhard.thonhauser@tde.at.
|
|
| |
Eric Maidla is president of TDE Petroleum Data Solutions Inc. and part owner in Slider LLC and Nexen Data Solutions Inc. He founded the first petroleum engineering course in Brazil at Unicamp (1988-1995) and helped start the drilling research group in Australia with the Commonwealth Scientific and Industrial Research Organisation (CSIRO, 1995-2001).
|
|
|


