The natural gas market in 2017
Natural gas market fundamentals exceeded expectations during 2017, according to CEDIGAZ, the International Association for Natural Gas. Global natural gas consumption rose 3.3%, to reach a new peak of 3,640 Bcm (128.5 Tcf) in 2017, according to CEDIGAZ’ First Estimates 2017 report (May 2018). Macroeconomic factors (abundant natural gas supply, economic growth) contributed to this bullish trend. Regulatory and policy factors also explained this performance. Considering the average growth of 1.5%/year during the five previous years, the 2017 performance looks impressive.
DEMAND
The biggest story of the gas markets (Fig. 1) in 2017 was the huge growth in Chinese demand (+15%/+30 Bcm/1.06 Tcf). This achievement resulted mainly from the ongoing intensification of environmental policy, enhancing coal-to-gas switching. The Middle East and Africa both also posted strong increases, at 4.8% and 6.7% respectively, aided by improving infrastructure, incremental CCGT generating capacity and availability of gas (Iran, Egypt).
In Europe (Turkey included), natural gas consumption was up 4.8%, helped by both the competitiveness of gas relative to coal and the weakness in nuclear and hydro energy. In the Commonwealth of Independent States (CIS), natural gas consumption returned to growth in Russia, driven by heating and the resumption of industrial activity.
In the opposite direction, consumption was sluggish in North America (U.S.) and South & Central America. In the United States, gas consumption posted an unusual drop in 2017 (–1.4%), following seven years of strong growth, amid higher natural gas prices. Natural gas consumption in the power sector fell more than 7%, as the strong expansion of renewables affected the gas position in the power merit order.
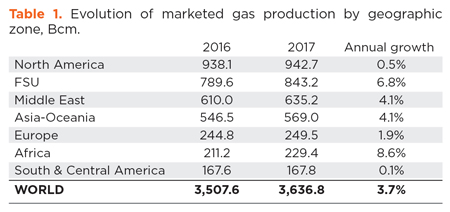
SUPPLY
On the supply side, marketed natural gas production grew robustly, at an annual average rate of 3.7%, to 3,637 Bcm (128.4 Tcf) in 2017 (Fig. 2, Table 1), well above the past five-year average of 1.3%/year. Growth was above average in the FSU (+6.8%), Asia-Oceania (+4.1%) and Africa (+8.6%). In absolute terms, the FSU accounted for more than 40% of the global increment, followed by the Middle East (20%).
At the national level, Russia was the standout performer, with gas production rising 8.3% (+50 Bcm or +1.77 Tcf ). Robust production additions were also posted in Iran (+17 Bcm or +600.3 Bcf), Australia (+13 Bcm or +459.0 Bcf), China (+11 Bcm or 388.5 Bcf), Egypt (+10 Bcm or 353.1 Bcf) and Norway (+10 Bcm or 353.1 Bcf).
INTERNATIONAL TRADE
In 2017, international gas trade (net of LNG re-exports) pursued its acceleration, surging 9.1%, to reach a new record of 1,204 Bcm (42.5 Tcf), a reflection of growing import needs in Europe (+12%) and Asia (+10%). This result represents the strongest volumetric growth in history. Like the two previous years, the buoyant expansion of international natural gas trade was propelled by both pipeline trade (+8.5%) and LNG flows (+10.5%).
International pipeline trade expanded 8.5%, to reach a volume of 822 Bcm (29.0 Tcf) in 2017. The international pipeline trade was driven mainly by Europe’s growing import needs, as regional production lagged behind growing demand. Most of the increase in European gas imports was covered by pipeline gas imports from Russia (+11%) and Norway (+11%), which reached new highs in 2017.
Since 2014, Russia has increased its exports to Europe significantly, and its European market share has continued to rise, reaching 33% in 2017. Despite the strong growth of 17% in 2017, European net LNG imports remained much below their peak in 2010, as they have been displaced by available, competitive, pipeline gas supplies.
LNG EXPORTS/SUPPLY
And 2017 was the second year of the LNG growth spurt, with global supply accelerating 10.5% to 382 Bcm (13.5 Tcf), the strongest growth in LNG supply since 2010. As Australian LNG production ramped up, the expansion wave of LNG supply was boosted further by the U.S., Fig. 3. While the Pacific basin remained the largest source of LNG supplies, further widening the gap with the Middle East, the Atlantic basin increased its market share on the global LNG market.
But in contrast with market expectations of a supply glut starting in 2017, the year turned out to be a relatively balanced one for the LNG market. Rising demand in Asia (China) and, to a lesser extent, Southern Europe, absorbed much of the incremental supply, Fig. 4.
As LNG supply surged, and with the advent of an increasing number of spot trades, the gas market became more global. Balanced conditions in the global gas market increasingly influence international natural gas prices, as the proportion of purchases billed at the spot price rises.
At the national level, the U.S. has become a net natural gas exporter for the first time since 1957. On the import side, China overtook the U.S. to become the world’s third-largest natural gas importer after Germany and Japan. At the regional level, Europe and Asia consolidated their standings as the largest importing regions, while North America shifted from being a net importer to a net exporter, Fig. 5.
2017 CONCLUSIONS
Global natural gas demand’s above-average growth reshaped market fundamentals. It prevented the development of a global natural gas bubble, which was previously expected but actually proved to be unrealized for 2017. It contributed to higher international natural gas prices, which were also pressured by rising oil and coal prices. Forecasts for relatively sustained demand and solid economic growth explain the pressures expected on oil and gas prices in 2018. A further increase in gas prices during 2018 is also partly explained by the especially cold winter at the beginning of this year. ![]()
- The last barrel (February 2024)
- Oil and gas in the Capitals (February 2024)
- What's new in production (February 2024)
- First oil (February 2024)
- E&P outside the U.S. maintains a disciplined pace (February 2024)
- Prices and governmental policies combine to stymie Canadian upstream growth (February 2024)
- Applying ultra-deep LWD resistivity technology successfully in a SAGD operation (May 2019)
- Adoption of wireless intelligent completions advances (May 2019)
- Majors double down as takeaway crunch eases (April 2019)
- What’s new in well logging and formation evaluation (April 2019)
- Qualification of a 20,000-psi subsea BOP: A collaborative approach (February 2019)
- ConocoPhillips’ Greg Leveille sees rapid trajectory of technical advancement continuing (February 2019)

