What's new in exploration?
I recently attended the American Association of Physics Teachers’ (AAPT) Texas Spring Meeting in Nacogdoches, Texas, sponsored in part by the Society of Physics Students (SPS), The Texas Section of the American Physical Society, and the Texas Section of AAPT. The SPS moniker got me into some trouble in Chicago in the late 1960s. Marrying a physics teacher, who is a Fulbright Scholar, explains the rest.
Lidar technology. I listened to a presentation about Lidar technology to measure single-scattering properties of ice crystals, modeled as both horizontal plates and vertical columns (Saito and Yang, [Texas A&M], “Phase Matrices of Horizontally Oriented Ice Crystals and Their Applications in Atmospheric Sciences,” 2019, Poster, TS-AAPT, Stephen F. Austin State University.)
Saito and I were able to have fun exchanging knowledge of mutual investigations. Lidar is a single-laser source, single-receiver imaging device that we use in industry research to image subsea oil structures, to determine safety issues, if any. Research also wants to apply Lidar into deep water someday. However, while Lidar takes multiple scans, and some equipment operates as an array (huge for laser wavelengths) it is still a primitive, two-dimensional, one-reflector imager, about equal to your hospital’s MRI.
Marine engineers are working on combining multi-directional passes of the Lidar tool into a usable 3D color image, much better than your doctor’s B&W stripped picture [see 3D at Depth]. Seismic-image signal technology for oil field application is light years ahead of Lidar. Like seismic processors, Saito is using Maxwell’s equations to separate far-field scatter from near-field scatter of the one-dimensional, scalar reflection of the laser beam. Maxwell’s equations are a set of partial differential equations that, along with a set of assumptions about signal/reflective behavior at surfaces, describe mathematically source and receiver limits at physical boundaries. What is interesting is that Saito found phase differences in his strict assumptions of horizontal and vertical scatter. Phase change in seismic reflection for exploration is important. Digging into analysis of his solution method might be useful.
Vector spherical wave function. A second poster by Jiachen Ding, P. Yang, takes the laser scattering concept into vector space. “On the Convergence of Invariant Imbedding T-matrix Method in Computing Light scattering by Nonspherical Dielectric Particles,” ibid. Dr. Ding was examining the internal math of reflected signal for properties of transformation, using a “vector spherical wave function.” Spherical wave spreading here is similar, but not quite identical to seismic reflection theory. However, Ding’s model starts with assumptions of reflected particle size and shape. His work is an attempt to apply very high-frequency returned signal to iterate toward a solution of particle shape, refractive index and size. This may be an alternate way to fast compute processing to eliminate “non-geologic noise” from within large data sets found in EM and microseismic.
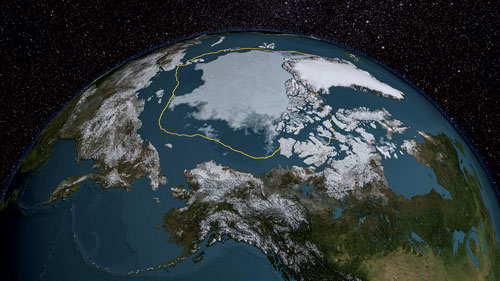
Arctic applications. Another paper dealt with Arctic applications that I link to possible environmental go/no-go decisions to explore new marine basinal areas (Bell, Yang [Texas A&M], Wu [NASA], “Understanding sub-millimeter wavelength ice cloud property retrievals in the presence of mix phase clouds,” ibid).
Assumptions were made about the size and shape of ice particles, and creating a flow model of just where infrared images originate from, within the significant scattering of signal now being used commonly to determine ice in the atmosphere and to calculate the Earth’s radiation “budget,” as used by regulators, Fig. 1. Bell also has no data, yet, to compare, just simulations from a series of assumptions. Why? Accurate information about ice clouds over the Arctic today are mono-signal, assumptive that all reflective data are created from a homogeneous, single-layer cloud. Have you ever been up north over the water? A single cloud layer over that water is rarely the case. We need a lot more studies before condemning activity north of latitude 66°33′47.5″ N, based on ice predictions from satellites.
Dr. Bell stated that his greatest concern in his model was the assumption of shapes of ice particles, and ice particle effective diameter. The model, difficult to calibrate, uses sub-mm wavelength technology. This sounds like the struggles that rock physics gurus Mavko, Mukerji and Dvorkin have in picking models for both size and shape of rock particles surrounding various shapes of porosity present on a micro level, in rather non-homogenous sub-matrices of reservoirs but measured with macro tools (see The Rock Physics Handbook: Tools for Seismic Analysis of Porous Media, Cambridge University Press, 2013).
The presenters, once coached about oil and gas applications, were encouraged and maybe even enthusiastic about trying their solutions to a new world—ours. WO
- What's new in exploration (November 2023)
- What's new in exploration (March 2023)
- The last barrel (January 2023)
- What's new in exploration (January 2023)
- Nova Scotia’s re-starting of exploration is a solid move, says exploration expert (January 2023)
- Developing an F22, umbilical-compatible scale inhibitor for West Africa (November 2022)
- Applying ultra-deep LWD resistivity technology successfully in a SAGD operation (May 2019)
- Adoption of wireless intelligent completions advances (May 2019)
- Majors double down as takeaway crunch eases (April 2019)
- What’s new in well logging and formation evaluation (April 2019)
- Qualification of a 20,000-psi subsea BOP: A collaborative approach (February 2019)
- ConocoPhillips’ Greg Leveille sees rapid trajectory of technical advancement continuing (February 2019)

