Stage-level flow assurance helps refine Permian field development strategy
Given the heterogeneity characteristic of many unconventional reservoirs, stage-level mapping of flow behavior at the onset of field development provides critical insight that can help ensure maximum drainage and returns on investment (ROI), as new wells are completed and produced.
The capacity to definitively analyze the performance of individual fracturing stages in the parent well provides a wealth of data that can be incorporated to shape optimal lateral placement, lateral length and stage spacing of subsequent wells. Capitalizing on the observations from detailed flow profiles enables maximum drainage from each stage, while also mitigating production-depleting inter-reservoir communication, or frac hits, as a multi-well pad is completed.
However, owing to the tight margins intrinsic of the unconventional space, the often-exorbitant incremental costs of conventional diagnostic methodologies have made stage-level flow profiling largely unattainable, even more so as the majority of today’s operators must focus on improving free cash flow and restoring shareholder returns. Alternatively, the recent emergence of uniquely-tagged and non-hazardous nanoparticle tracer technology, coupled with data-driven analytics, has been shown to deliver precise stage-specific flow-behavior data at a fraction of the costs of traditional diagnostics.

Tall City Exploration tested that assertion in the first of what is planned to be a multi-well development in a less delineated section of the Permian basin in Texas’ southern Reeves County, Fig. 1. The primary objectives of the initial well were to gain detailed stage-level information on reservoir quality and characteristics to help guide the well landing, stimulation, and completion strategies of subsequent wells, and to do so while remaining within budgetary confines and targeted return on investment (ROI) for each stage. Furthermore, with limited offset data available, it was crucial that laterals with stimulated reservoir volume (SRV) avoid communication with adjoining operators’ acreage.
Analysis of the flow profiles obtained from the tracer deployment in this undeveloped acreage has increased the learning curve appreciably. It also has enhanced drilling and completion strategies, both mechanically and chemically, as Tall City prepares to fully develop the virgin acreage.
Stage-level flow profiling. The capability to economically examine stage-by-stage flow behavior can pay tremendous dividends in the planning of shale field development and help deliver the highest possible yields from future investment, Fig. 2. For multi-stage wells, stage level profiles leading to the identification of non-productive, minimally productive, and highly productive stages along a lateral experiencing significant heterogeneity are quintessential to field development. Stage flow and communication behavior profiles augment efforts to maximize production and estimated ultimate recoveries (EUR) across the lateral, minimize unnecessary drilling and completions costs associated with infill wells, and right-size the well spacing. Further, as a number of authors have suggested,1,2,3 the costs associated with infill of exceptionally wide variances in the reservoir characteristics of multi-zone plays, like the Permian’s Delaware basin of West Texas and southeastern New Mexico, accentuate the benefits of quantifying the productivity of individual stages.
Historically, the generation of stage flow profiles, using either chemical tracers or more complex and intrusive diagnostic methodologies, has been cost-prohibitive, save for a scant number of ostensibly engineered science wells. The solubility of conventional chemical tracers, for instance, requires customization for the individual fluid phase, thereby requiring more, and often exotic liquid chemical formulations for a single stage, increasing the costs considerably. Given the inherent heterogeneity of shale rock along a typical horizontal lateral and the assorted fluid streams, the different types of chemical tracers required could add significant incremental costs/well. Liquid-based tracers, typically, disseminate quickly in the discrete fracture network (DFN) beyond the propped fractures, and once pumped occasionally, produce false positive frac-hit signals on adjacent wells or are flushed from the proppant pack, shortening the effective monitoring period significantly.
Aside from tracers, production logging tools (PLT) require costly shut-ins and wireline operations, while providing only an observation for multi-phase flow at a single point of time during wireline operations. While PLT-derived production logging data can provide a snapshot of reservoir quality and completion performance, the added costs have rendered it cost-prohibitive for unconventional well development programs.
Likewise, premium fiber optic-enabled distributed temperature surveys (DTS) and distributed acoustic sensing (DAS), both of which deliver a high degree of detection accuracy during frac operations and can increase overall well costs up to $1 million/well, depending on well size and complexity. DTS and DAS systems, which must be installed prior to completion, necessitate extensive well stimulation and completion modifications with pre-defined fiber positioning and phasing behind the casing. Many times, this requires oriented perforations with a very narrow margin for error accompanied by pumping changes, all of which come at costs beyond the risk-return profiles of most shale operators. Additionally, the fibers detect inter-well communication during the fracturing process at each stage but are less proficient at mapping inter-well communication during production, due to sensing requirements for acoustic and temperature changes. The high cost associated with DAS and DTS systems, in conjunction with the significant risk of fiber damage or total signal loss during contemporary plug and perf operations, greatly reduces the repeated deployment of this technology for many operators.
Microseismic is another costly technology that generates shear failures data during the fracturing process that can measure fracture geometry, but it is unable to provide direct answers concerning stage production and flow profile. The limitations and often prohibitive costs of traditional liquid tracers and other diagnostic technologies drove the development of the integrated smart tracer portfolio and digitally enabled intelligent completion diagnostics. The intention was to go beyond providing the client data points, by leveraging extensive expertise in frac diagnostics to develop new-generation technologies and workflows with a costing model, which would fit within the economic capabilities of all operators in the unconventional sector.
Uniquely engineered nanotracers. As demonstrated in a number of unconventional wells, the ultra-high-resolution nanoparticle tracer portfolio consistently quantifies the flow behavior of individual stages, while narrowing the wide economic chasm that previously made stage-level flow mapping inaccessible to mainstream shale wells. The non-intrusive nanoparticle-based tracers are proven to deliver accurate and near-real-time detection beyond the capabilities of conventional chemical tracers and DNA sequencing technologies.
The non-radioactive intelligent tracers were formulated for sub-atomic detection accuracy, enabling exceptional surface recovery rates, which are proportionate to the hydrocarbon production. Based on differentiating diagnostic field data, the technology exhibits a high level of precision in mapping field-wide inter-well communications, or infill frac hits. When coupled with sub-atomic measurements, the tracers provide accurate and robust detection capabilities. Moreover, laboratory analyses incorporating big-data analytics, advanced 3D reservoir flow visualization and nanoparticle detection capabilities provide accurate, calibrated and cost-effective completion diagnostics results.
The FloTrac tracer portfolio comprises more than 100 uniquely tagged proprietary particles developed from cost-effective and environmentally friendly materials. During the pre-commercialization testing protocol, each smart tracer was evaluated for specific characteristics, including high thermal (up to 2,000°F) and pressure stability, settling time, particle size distribution (PSD), and elemental composition, as well as reservoir static and dynamic adsorption.4 The next phase involves aligning and refining each smart tracer with the pre-planned multi-stage frac stimulation design, pumping schedule and the estimated completion flow profile. This step validates performance under real-world subsurface conditions, including recovery efficiency under minimum and maximum flow velocities at the stage level.
Assuring a low-cost structure was ranked as a primary criterion at the onset of the development program, thereby leading to the engineering of a single tracer formulation that would be equally compatible with both oil and water. Consequently, only one tracer type would be required for each stage, effectively cutting the cost in half, compared to conventional chemical tracers.
Unlike their liquid counterparts, once the smart tracers are deployed, they tend to stay in the proppant pack, rather than quickly dissolve within the fracture network, thus extending the recovery time considerably and enabling continuous measurement and monitoring of the production profile for up to seven months after deployment. Furthermore, the particles are incapable of penetrating into the small fissures that open up during the hydraulic fracturing process, mitigating the false positive frac hit signals that are all-too-common with chemical tracers, and avoiding unnecessary and costly reactive measures.
As illustrated in the Reeves County well, the smart tracers are easily deployed—with a precise automated dosage system—during the stage pumping process and require no additional surface equipment or downhole modifications to the completion.
Well program. Tall City Exploration is operating in the Permian basin, where some 21,400 net acres are under control with multiple stacked pay prospects. The total leasehold includes contiguous and non-contiguous undeveloped acreage in a comparably less exploited section of the Permian Delaware basin in far West Texas’ Reeves County, south of Pecos. There, this parent well in a planned multi-well development was drilled and completed.
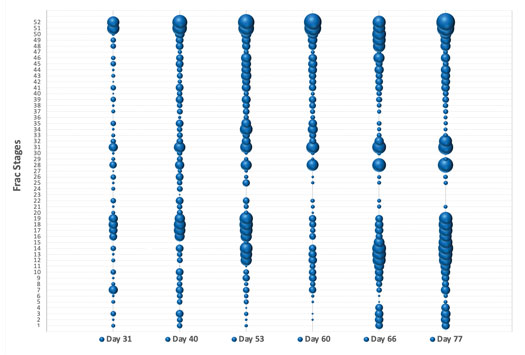
The well was drilled to a measured depth (MD) of 20,072 ft, with a 9,272-ft lateral reach, primarily targeting the Wolfcamp A and Bone Springs shale formations. Using 100-mesh and 40/70-mesh proppant, Tall City completed the well in 52 stages, with relatively uniform 160-ft inter-stage spacing, Fig. 3.
As this was the first well on the acreage, the primary objective for Tall City was to gather detailed data on flow behavior, to help drive well placement in the subsequent wells and ensure the entirety of the laterals penetrate reservoir sweet spots. Moreover, with restricted offset data, it was also incumbent on the completions team to avoid communication with neighboring operators’ wells.
To economically demonstrate the production profile down to the individual stages, Tall City pumped the nanoparticle tracers as part of the slickwater plug & perf completion, with the intention of acquiring granular flow data without increasing the completions costs and lease operating expense (LOE).
Tracer deployment/sampling. Using a proprietary composition and fingerprinting process, QuantumPro pumped a unique nanoparticle tracer for each of the 52 stages. Before deployment, all of the smart tracers underwent rigorous laboratory testing and validation processes to ensure ultimate downhole performance within the complex fracture network. During the comprehensive pre-deployment testing process, the smart tracers are evaluated with respect to thermal and pressure stability, size distribution, settling, elemental composition, and other application-specific characteristics.
For each injection, the tracers were pre-mixed in a specialized liquid, and pumped with the slickwater fluid stream and unobtrusively fed to the frac blender during the pumping of each stage. The tracers were deployed in a pre-defined pumping schedule, with sand concentration from 0.25 to 2.0 PPA and at a maximum treating surface pressure of 11,000 psi. The smart tracer injection process is recorded and streamed live into the Cloud for real-time quality assurance and quality control (QAQC), and correlated with frac pumping acquisition data from each stage.
The well was placed on production a week after completion work was finished. The tracer tech team began collecting samples from day one of production to map out the tracer recovery, down to individual stages. The samples were collected directly at the wellhead, enabling detection of the best possible signal, as the tracers come out from the well. The team was especially careful to prevent cross-contamination between samples and followed a rigorous sampling QAQC protocol. The sampling commenced at a daily frequency for a period of two weeks to acquire the high-resolution and high-frequency results for the critical well unloading period, with a focus on water recovery. Thereafter, the sampling changed to weekly sampling, focused on oil flow mapping for a period of 10 weeks, before shifting to monthly sampling This provided a comprehensive long-term view of flow assurance across the lateral and advanced production diagnostics. All samples were analyzed in a dedicated analytical lab for tracer recovery, composition, and flow allocation for each stage.
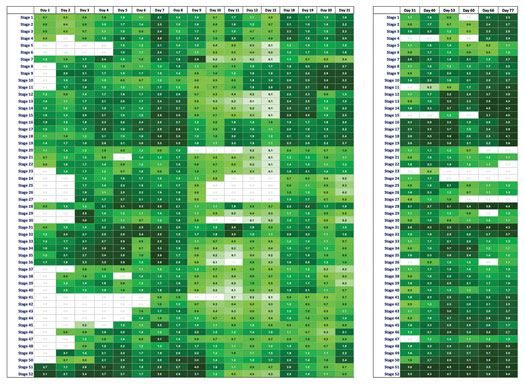
Observations. Data-driven recovery analysis of the individually tagged tracers showed that, for the most part, the completed fracturing stages contributed, in markedly varying degrees, to overall production. Although tracers were recovered successfully from all stages, the recoveries were significantly lower from stages 20-27, suggesting poorer reservoir quality in that portion of the relatively non-linear horizontal section.
In this instance, tracer recovery analytics present themselves much like pseudo-open-hole log data, which are rarely, if ever, collected in contemporary unconventional reservoirs. Consequently, by coordinating tracer recoveries, which is representative of rock quality, completion effectiveness and subsequent oil production correlated with depths, the tracers can be used to navigate lateral placement in the better producing areas of the leasehold.
Moreover, recovery data verified a generally held assumption on the flow behavior of shale wells in that the nearer-to-surface heel stages initially came on-line quicker, and at higher rates than the toe stages. However, as exhibited in the tracer profile, once farther afield, toe stages 1 through 19 began communicating, they contributed significantly higher production rates than their heel counterparts. The spike in oil production from the toe stages dictated additional frequent sampling and analysis, which offered extensive insights on flow behavior changes across the entire lateral over longer periods of time.
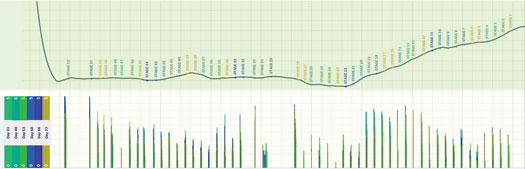
That phenomenon is illustrated in more granular detail in Fig. 4. The oil tracer recovery profile preceeded a similar plot showing appreciably higher water flow during the first month of production, primarily owing to the large volumes of spent frac fluid flowing to surface, as well as the notoriously high water cut intrinsic to the Delaware basin.
Importantly, though offset well information was limited, data from adjacent operators showed no post-frac communication with their reservoirs.
Recommendations. The data derived from the stage-level flow profile of the debut well provides valuable intelligence that offers a number of options to guide the drilling and completion strategies of the upcoming infill development campaign.
The overall flow profile of the Reeves County well immediately suggests the first changed variable should be to land the lateral higher, to ensure all stages are encountering the sweet spot. Based on the incremental production, signified by the tracer recovery-depth relationship, cut points should be set to maintain lateral placement above 9,900 ft, to determine if doing so will exploit better reservoir quality.
Landing the lateral higher, with a corresponding focus on the higher-producing stages, will likely avoid the added costs of completing stages that are not performing at optimum levels. On the basis of the stage-level flow mapping, the completions design team could also consider increasing inter-stage spacing, completing fewer stages all within the sweet spot, would reduce costs while achieving the same or better production.
As the infill drilling and completion campaign progresses, it is also recommended that the tracers be deployed on zipper or even simul-fracs to further reduce the multi-well development costs and obtain the critical inter-well communication data.
Going forward, the smart tracers will play a pivotal role in the development of the Reeves County acreage, as Tall City continues to evaluate the production data and EUR potential from the first well to refine the design of future wells. Incorporating the learnings from this well, down to stage placement and continued use of the next-generation ultra-high resolution smart nano-tracer with data-driven analytics, will ideally help identify an optimum well design that can be replicated throughout the development program.
REFERENCES
- Ramiro-Ramirez, Sebastian, Athma Bhandari, Peter Flemings, and Robert Reed, “Porosity and permeability heterogeneity in the upper Wolfcamp, Delaware basin, West Texas: Implications for production,” URTEC paper-2020-2105, presented at SPE/AAPG/SEG Unconventional Resources Technology Conference, July 20-22, 2020, virtual.
- Entzminger, David, Mohamed K. Zobaa, “Source-rock evaluation: Best tactics for finding the sweet spots within unconventional and conventional reservoirs in the Permian basin,” AAPG Search and Discovery, Article #42569, Feb. 22, 2021.
- Xiong, Hongjie, Songxia Liu, Feng Feng, Shuai Liu, Kaimin Yue, “Optimizing fracturing design and well spacing with complex-fracture and reservoir simulations: A Permian basin case study,” SPE Production & Operations, paper No. 194367, Dec. 16, 2019.
- Shokanov, Talgat, John Oliver, Adilkhan Shokanov, David Pena, “Inside the data-driven completions of the future,” World Oil, May 2020.


- Shale technology: Bayesian variable pressure decline-curve analysis for shale gas wells (March 2024)
- Using data to create new completion efficiencies (February 2024)
- U.S. oil and natural gas production hits record highs (February 2024)
- When electric meets intelligence: Powering a new era in hydraulic fracturing (January 2024)
- Next-generation electric fracturing system improves efficiency, ESG performance (January 2024)
- Going global with unconventionals (December 2023)
- Applying ultra-deep LWD resistivity technology successfully in a SAGD operation (May 2019)
- Adoption of wireless intelligent completions advances (May 2019)
- Majors double down as takeaway crunch eases (April 2019)
- What’s new in well logging and formation evaluation (April 2019)
- Qualification of a 20,000-psi subsea BOP: A collaborative approach (February 2019)
- ConocoPhillips’ Greg Leveille sees rapid trajectory of technical advancement continuing (February 2019)

