Unconventional fracturing: Implications of particle transport through the casing
Several universities and other companies have initiated theoretical projects, attempting to better understand proppant placement in multi-cluster, limited-entry fracture stimulations. GEODynamics worked closely with a number of operators to further knowledge via large-scale surface tests. This is believed to be the first surface tests conducted, and learnings were substantial.
Six operators, by order of joining the project, included PDC Energy, Hess, Jagged Peak, Chesapeake, Apache and ExxonMobil. After a water-only qualification test in 5.5-in., 23#, P-110 casing, the program tested different proppant mesh sizes at ~90 barrels-per-minute (BPM) injection rates, using 1 gallon-per-thousand high-viscosity friction-reducing fluids. Eight, 13, and 15-cluster configurations, with each cluster having its own individual tank to capture fluids and proppant, were tested. Uniform equal-entry hole size charges were used, with the perforated hole size designed for ~1,500-psi differential at this injection rate.
As background, from a particle transport perspective, the group began questioning the validity of industry’s assumption that proppant and fluid travel uniformly together in the casing of multi-cluster, unconventional, fracture stimulated completions. At the very high pump rates the industry currently employs, simple math suggests that the transit time by the higher-velocity heel-side perforations is less than 0.5 milliseconds. At those velocities, will the proppant exit the casing as easily, and travel uniformly with the fluid? The team’s simple analog was “do you think a car can make a 90° exit off the freeway at 100 miles an hour?”
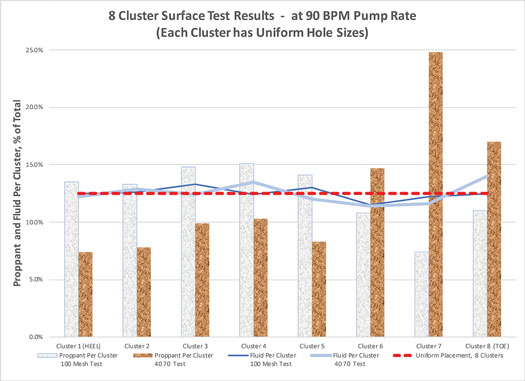
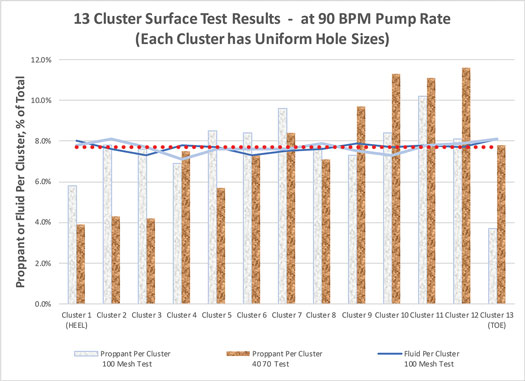
PDC Energy came forward, and the companies collaborated to conduct an 8-cluster, 6-shot-per- cluster test (60° phasing). Results were so surprising that the operator group was formed, and a 13-cluster, 3-shot-per-cluster (120° phasing) design (Fig. 1) showed similar results—fairly uniform fluid placement while there was a three-fold difference in proppant per cluster (in the case of 40/70 proppant). The third series of tests included both high and low flowrate tests with 15, 1-shot clusters, with both perpendicular and angled perforations all positioned on the low side of the casing.
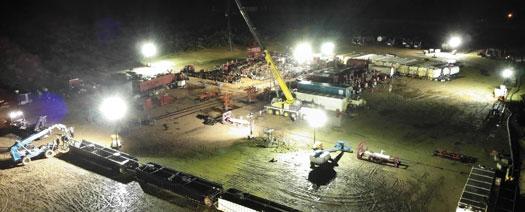
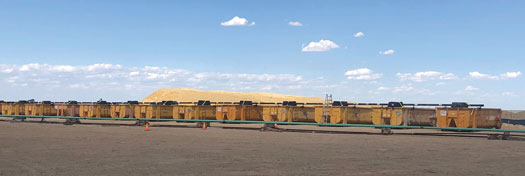
Executing the tests at 90 BPM through 5.5-in. casing, with individual tanks collecting fluid and proppants, proved to be a difficult task, especially managing the test apparatus erosion. The group immediately recognized that the logical place to conduct these highly instrumented tests was on location, essentially rigged up as another “well” during frac operations on a pad.
The cover of this September issue of World Oil is a graphical rendering of the general approach: 1) Multiple frac lines from the pumps to a horizontally mounted frac head, which was connected to the 5.5-in. casing; 2) the perforated casing for each cluster was centered in individual tanks, which collected the fluids and proppant; 3) larger casing shrouds (13.625-in. and/or internally hard-banded 20-in. casing) were centralized over the perforation intervals, and rubber horse troughs diverted all the fluids and proppants into the individual tanks; 4) a bull plug ended the test assembly approximately 10 ft beneath the toe side cluster.
The collected data included real=time fluid level measurements in each tank; before-and-after sand and fluid levels in each tank; real-time pressure measurements at each cluster; before- and-after hole size measurements; individual tank sieve size analysis; and even drone videos. Pressure/rate data from the frac fleet were recorded. The slurry velocity exiting the perforations at ~ 300 ft/sec was quite erosive, when it impacted the containment equipment.
Tests in some cases were shut down when fluids ceased to be contained in the tanks. In one case, erosion occurred though the 13.625-in. casing shroud, which was centralized outside the 5.5-in. casing, through two layers of 1-in. logging chain wrapped around it and then through the outer 20-in. casing shroud. Total assembly length was in the 200-to-240-ft range, per operator requests to replicate stage length.
Over time, 17 different surface tests were completed; proppant sizes consisted of 20/40 and 30/50 sieve sizes on a couple of tests, but they were predominately 40/70 and 100 mesh. Both perpendicular (to the axis of the casing) and angled perforations were included in this test matrix. The program selected and utilized charges out of existing inventory to verify actual hole sizes to corresponding published data and essentially “blind tested” the charges. The group also “blind tested” acoustic fiber attached to the outside of the casing.
Results were very intriguing and will be part of technical papers that the group plans to subsequently release. It brings into question some interpretation assumptions that companies make. Likewise, before and after downhole camera hole size logging runs were conducted and interpreted as a “blind test.” The physical caliper measurements did not match the camera data as well as anticipated. The project has now moved into conducting downhole tests, based upon the surface test learnings.
The group recently decided to release some results gathered to date. It is believed that these actual physical results from the full-scale surface tests will help the efforts of industry consortiums and universities with ongoing research. A series of other technical and more detailed papers will be released.
Computational Fluid Dynamics (CFD) modeling was carried out and compared to the experimental results. A group then wrote software and developed a sand/fluid placement model, incorporating other variables.
Overall, the author and many of the participants believe the data should be interpreted, as follows:
- Proppant placement is a function of fluid velocity in the casing, and particle size/density plays a major role. It would not be uncommon under similar conditions to have two-to-three-fold more 40/70 proppant in the lower fluid velocity clusters, Figs. 2 and 3. Due to the relatively low particle mass, 100 mesh sand can be placed more uniformly.
- The orifice flow equation, although developed for flow in the same direction, still works fairly well for the real-world case of the fluids and proppant streams having to make a 90° turn. Discharge coefficients are not uniform. The coefficient of discharge varies as a function of fluid velocity and is different between angled and perpendicular charges, and if proppant is in the fluid stream.
- Perforation erosion is impacted by fluid velocities, proppant source, and pressure differential. Perforation erosion is not simply a function of the amount of proppant placed through the hole. Angled perforations showed significantly less erosion than perpendicular perforations during these tests.
- Perforation orientation in the casing matters in terms of proppant placement. Proppant concentration from the high side to the low side of the casing is believed to be not uniform and is a function of fluid velocity and particle size.
- Sand dunes can form between the lower fluid velocity clusters (proppant settling, induced by lower fluid velocities), and this has significant implications to the viability of operations, where the operator hopes to produce the well back without a clean-out trip.
- When pumping 100 mesh proppant and tailing in with 40/70 sand, the larger particle size proppants are not going into the same clusters at the same concentrations.
- A predictive model for proppant placement, as a function of each perforation size and orientation, fluid velocities and viscosities, particle size and proppant concentrations across the pipe, was developed and validated from the surface tests. The results suggest different proppant placement per cluster if, for example, all the perforations were oriented straight up versus straight down.
- Operators may want to reconsider their analyses, based on “proppant per lateral foot,” due to the belief it is much less uniform than they may have believed.
- It may be easier to explain “frac hits,” if people begin to realize the vast differences in proppant concentrations and perforation erosion rates per cluster. Considering fluid injection per cluster is a function of the perforation hole diameter to the 4th power; it is conceivable the toe-side clusters could have substantially more perforation erosion early in the job and subsequently receive even more fluid and proppant.
- Perforations closely spaced in a line may not take fluid and proppant the same as if they were independent.
- Sieve analysis on an individual tank basis showed indications that the smaller particles more readily enter the higher fluid velocity clusters, and the larger particles migrate to the toe-side lower velocity clusters. An even more interesting point, looking at all the microscopic photos, is the vast differences in locally mined sand quality within the same geographic region.
- It is believed that many of the industry’s past surface tests with a single perforation or cluster and no flow past the cluster may need to be scrutinized in more detail. Additionally, it seems obvious that past tests, where flow paths were in the flow direction, instead of perpendicular to it, may give different results.
Commenting on the graphs shown in Figs. 2 and 3, Steve Baumgartner, a long-time industry fracturing expert and project co-coordinator, summarized the results pretty simply. “With everything else the same,” he said, “there is an excellent chance one could place three-fold more 40/70 proppant in the toe-side clusters than the heel-side clusters, while the fluid per cluster is still pretty uniform. Whether it’s perforation erosion, proppant placement, proppant settling, acoustic energy or a host of other things, our industry needs to consider fluid velocity through the casing. We certainly recognize the industry’s knowledge and focus on rock mechanics, stress differentials, etc. are not in error, but the transport mechanisms through the pipe and out the perforations perhaps need more emphasis than previously given.”
- Shale technology: Bayesian variable pressure decline-curve analysis for shale gas wells (March 2024)
- Using data to create new completion efficiencies (February 2024)
- Digital completions platform provides complete operations visibility to enhance efficiency, collaboration (December 2023)
- Delivering a full range of innovative well completion technologies (September 2023)
- Downhole tool integrity maximizes completion efficiency and ultimate recovery (July 2023)
- Enhancing stimulation efficiency in a fractured open-hole carbonate reservoir by diversion design using advanced modelling techniques (May 2023)
- Applying ultra-deep LWD resistivity technology successfully in a SAGD operation (May 2019)
- Adoption of wireless intelligent completions advances (May 2019)
- Majors double down as takeaway crunch eases (April 2019)
- What’s new in well logging and formation evaluation (April 2019)
- Qualification of a 20,000-psi subsea BOP: A collaborative approach (February 2019)
- ConocoPhillips’ Greg Leveille sees rapid trajectory of technical advancement continuing (February 2019)

