Automated offsets bring a new dimension to drill bit performance evaluation at scale
The drill bit market is only about 1% of today’s total global oilfield services market, according to 2022 industry calculations, yet bit performance is extremely important to improving overall drilling performance and reducing well construction costs. Drill bit designs, cutter shapes, materials and components can contribute to decreased drilling time by either increasing overall ROP or increasing footage drilled before the bit needs changing, or both.
Traditionally, drill bit performance was evaluated on a run-by-run basis and measured in terms of drilled footage and ROP versus similar offset runs that were both comparable to, and utilized bit designs relevant for, the test run. Offset runs were selected in various ways, but they were typically chosen manually by bit engineers, meaning that offset run selection was subjective, based on personal experience and bias. Additionally, evaluated runs were generally limited to bits in the design phase.
With the passage of time and the evolution of data science and digital technology, the scope of measurement criteria evolved to include much more than simple drilling performance and bit data. Evaluation now requires querying a vastly expanded database, exporting the data to an Excel spreadsheet format, then manually evaluating it. For a global-scale question, selecting offset runs and arriving at answers to key questions could take a week or longer.
CHALLENGE
Meeting today’s operational challenges requires that bit designs be iterated and evaluated quickly and accurately. The drill bit market is highly competitive. The entire product development process may take as little as one to three months. And pressure is growing to analyze and monitor the performance of all bit runs, even after the testing phase is complete, to fully understand their performance at scale and across geographies.
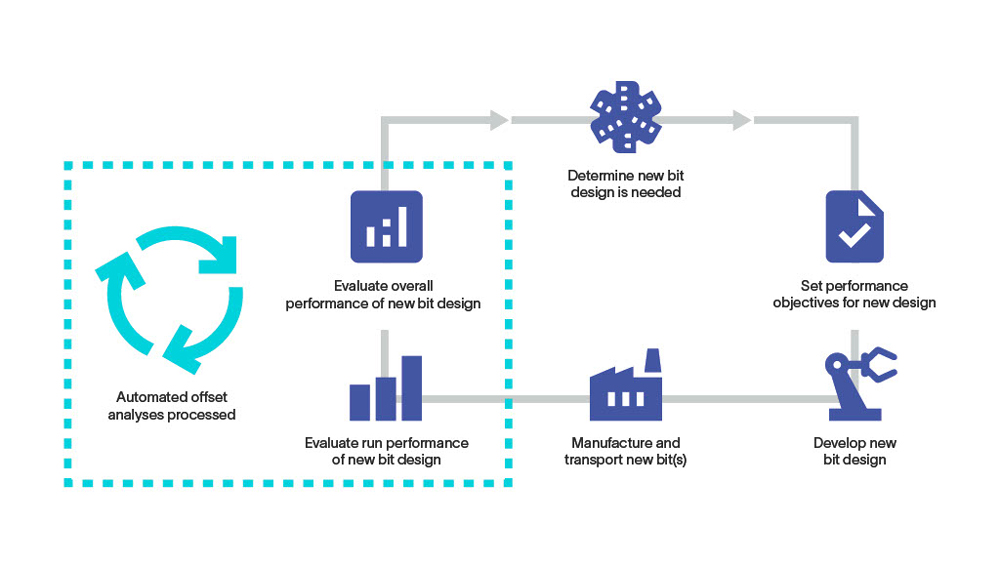
The ability of a bit provider to accurately quantify the performance of its products for any type of application, timeframe and location—particularly compared to those of its competitors—is paramount for performance monitoring of existing bits and for new product development. Automation is needed to aid performance evaluation, Fig. 1.
Data: The foundation. Regardless of the target resource, when the drilling operation is complete, the drilling performance data are stored within a database. Such a database, and the quality of data within it, is of significant importance to the service company and its customers, because these data are foundational for advancing drill bit technology and with it, drilling performance and well construction efficiency.
The collection, storage and management of offset bit run data is the crucial backbone needed to build and interpret various metrics that ultimately result in lowered well costs. It drives decisions, such as which drill bits and tools are to be used. It is used to analyze the effects of new technologies, such as cutter grade and shaped diamond element types. It is also used to evaluate the success or failure of new bit and tool designs.
SLB’s drill bit business is largely based on an in-house database called the drilling record system (DRS) that captures global bit record performance data. Originally developed in the 1980s to capture simple drilling performance and bit data, the scope of the database has expanded to capture a wealth of contextual well data, including surface location, trajectory, casing string, and formations and geology drilled. The database also captures detailed run data, including drillstring design, surface and downhole drive system types. The comprehensive database also includes downhole tools utilized, drilling fluid type/properties, operating parameters and the drill bit itself.
Drill bit details include the size, manufacturer, model, serial number, part number, International Association of Drilling Contractors (IADC) bit classification code, condition after usage—known as the IADC dull grading—and reason pulled. These data are captured and screened for accuracy globally by a dedicated team of field representatives, data entry specialists and application engineers. As of October 2022, the DRS encompasses more than 1.8 million wells and 7.5 billion ft drilled worldwide since 1980. As a frame of reference, 7.5 billion ft is the equivalent of drilling from the surface of Earth to the surface of the moon about six times (three round trips).
Extracting value from the data. The DRS, like any good application, continually evolves to improve the user experience. This includes the database’s analytics capabilities, which allow users to fully extract the value of the data. Among the team’s successes in this realm is its adaptation and application of online analytical processing (OLAP) and data cube technology to power a wide range of reports and dashboards crucial to the business.
Data cubes are data structures that, contrary to tables and spreadsheets, can store data in more than two dimensions. They are used mainly for fast retrieval of aggregated data. Online analytical processing is a technology that organizes large business databases and supports complex analysis. It can be used to perform complex analytical queries without negatively affecting transactional systems.
OLAP cubes have been developed to analyze the performance of drill bits, motors, reamers, rotary steerable tools, and many more downhole tools. The DRS cubes assist in identifying failure causes on bits to identify high-risk intervals and to better target products and parameters to reduce costly nonproductive time.
The development of the OLAP cubes required a multidisciplinary team consisting of software developers, business managers, domain champions, field-based engineers, and data scientists. The cubes consist of multidimensional databases built from relational and algorithmic interpretations of DRS transaction data. These algorithms are generated and developed by an iterative cycle of continuous improvement, development, and utilization of the OLAP cubes in parallel to improve the functionality and business impact for performance analysis, sales, product development, product reliability, and marketing.
The data can be analyzed and visualized in the Microsoft Office suite by directly querying the DRS OLAP cubes. This also allows for dashboards to be updated in real time, as data are added to DRS. This OLAP cube development has allowed for increased usage of the world's largest drilling record database, made it easier to access and analyze the data, and improved decision-making through data-driven analytics.
Putting the data to work: automated offsets. Answers to the following questions are necessary throughout the drill bit product lifecycle:
- My latest experimental bit design was run yesterday. How did it perform?
- How did our best runs in a certain area or application do last week? Which runs outperformed?
- How did our technologies stack up against competitors’ last quarter? How is our performance trending over the last year?
Extracting value from large sets of drilling data requires an innovative approach. A design that is tested with one operator under specific parameters could obtain very different results when used by another operator and different parameter roadmap. To alleviate offset selection biases, enable a wider breadth of considered runs, and provide a broader perspective on its product’s capabilities, SLB developed and implemented an objective, automated offset run selection workflow within its DRS. The workflow is accelerating the overall drill bit development process by providing timely bit performance evaluation results to the bit engineering and sales teams, Fig. 2.
The auto-offset run selection workflow. Offset runs for the workflow are selected, based on a sophisticated filtering and scoring routine that considers many characteristics, such as geographic location, time, and wellbore and drilling system design, along with lithology. As new data enter the DRS continuously, this workflow runs on a regular basis using an automated pipeline. Product performance can now be evaluated objectively at scale across geographies, always using apples-to-apples comparisons. Automating the offset monitoring and evaluation process simplifies tasks, reduces logistics and makes results readily available to in-house performance and design teams. This improves due diligence and drives competition, and with it, continuous bit performance improvement.
How auto-offsets work. For each auto-offset analysis, the bit run to be evaluated is considered the subject run. For each bit run, the DRS searches for similar runs from nearby offset wells of the same bit family but from a different manufacturer. The initial filtering process for selecting offset runs considers bit family and diameter, location, depth in, and run date.
Next, all potential offset runs are scored to determine which are the most similar runs to compare the subject run against. This score is called the offset quality, and it is stored along with the offset runs considered for each analysis. The following criteria are taken into consideration when scoring the offset quality:
- Geographic distance between offset run and subject run
- Well target formation
- Well trajectory—vertical, tangent, curve or lateral
- Downhole drive type—steerable motor, rotary steerable system (RSS), motorized RSS
- Mud type—water-based or nonaqueous fluid
- Depth-in difference
- Run date difference
- Operator
- Drilling contractor
- Drilling rig
Each criterion has its own importance weight, which has been refined through expert user testing to ensure that the automated offset selection mimics what an actual person would choose. Finally, based on the offset quality scores, the top 10 most similar offset runs are determined for the analysis. Then, the performance of the bit run is compared to the median performance of the competitor offset bit run group.
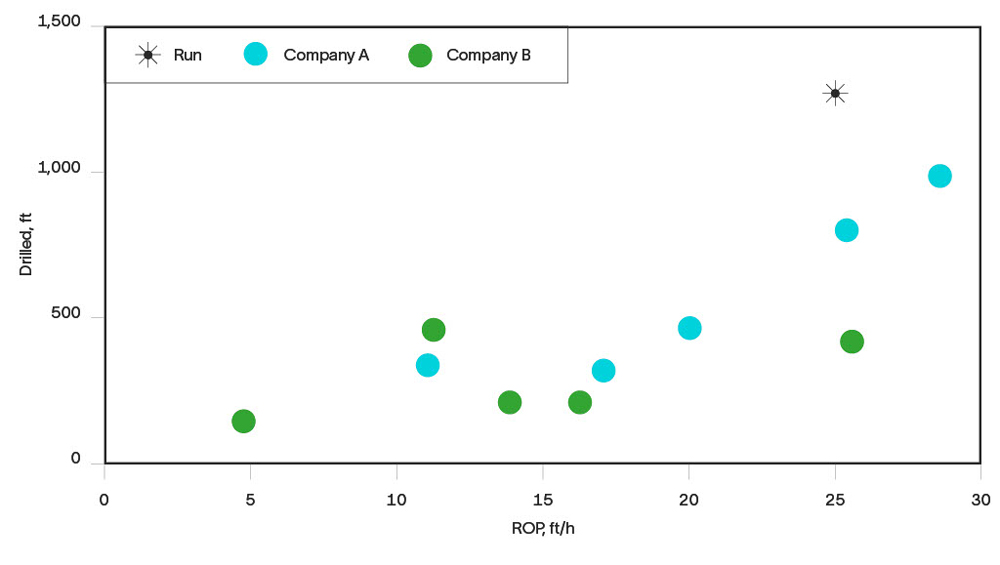
The new window shows the subject run and the (up to) 10 offset runs in both a plot (X-Y scatter of ROP vs. drilled footage) and data table with all the relevant run details. The results can be looked at from three different perspectives, ranging from a single run to global scale.
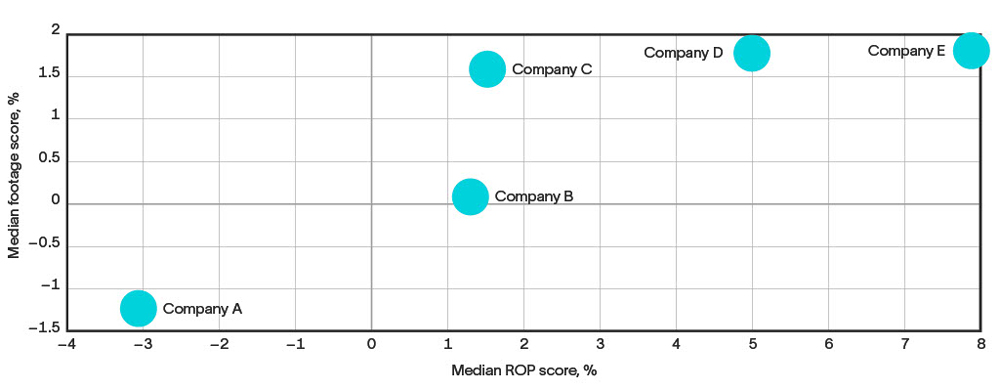
Evaluating performance. The drilling performance (drilled feet and average ROP) of the subject run is evaluated against the median drilling performance of the 10 most similar offset runs. "Improvement" scores for both drilled footage and ROP of the subject run are determined, using equations to determine improvement scores centered on zero. An improvement score of zero indicates that the subject run performed the same as the median of the 10 most similar offset runs. A positive improvement score means that the subject run performed better than the median, while a negative improvement score means that the subject run performed worse than the median, Fig. 3.
If a selected bit outperforms the competitors in the auto-offset analysis, this information is communicated to that bit provider’s customers, to help them continually improve their operational performance. On the other hand, if the subject bit was outperformed, the provider can use this information to develop a new bit design to increase its competitiveness and its customer’s operational performance.
The strength of the evaluation lies in the scoring system and its relevance to real-world operations. Knowing the proximity, depth, and other auto-offset evaluation criteria raises confidence in the auto-offset performance evaluation results and in the insights those results generate. By using the auto-offset summaries and parsing the right data, macro evaluation can take place much faster to evaluate various technologies at scale.
Changing from retroactive to proactive. The entire auto-offset procedure runs on a weekly basis and is executed, using a highly efficient structured query language (SQL) script. A SQL server data warehouse typically offers a number of reporting, query, and dashboard options to extract data and provide it to the business users. This is necessary, as new drill bit runs are entered into the DRS each day. Every new drill bit run is both a subject run, for which an auto-offset analysis will be computed, and also a potential offset run for an existing analysis. As such, these analyses are a snapshot of the performance of a bit run at a given time, and may change as new run data are entered into DRS. This makes the process equivalent to the manual performance evaluation process that an engineer would carry out, but with the added benefit that the updated performance evaluation data is ready at any moment to evaluate without any human intervention.
Viewing the auto-offset analysis for a given run is a powerful retroactive process. Equally powerful is a proactive process that provides automatic notification about runs that outperformed competitor runs for their area. This is the function of the DRS Outstanding Bit Run Visibility Report. Each week, the report is automatically generated and distributed to the bit engineering group. It is split into separate pages, one per geographic area. Viewing it enables the people who are responsible for each geographic region to quickly identify and act on the outstanding runs that are most important to them.
The performance evaluation results of the automated offset selection workflow are available to all data analysts inside DRS and extensible applications to aid in performance monitoring and target setting for new product development. Product performance is now objectively evaluated at-scale across geographies and always using apples-to-apples comparisons.
CONCLUSION
The auto-offset workflow has proven to be extremely useful and has delivered business value. It also exemplifies the need for both enhanced data quality and improved bit record data capture rate. Efforts are ongoing to further enhance and improve this workflow.
The DRS team, and especially its administration team, makes significant efforts to capture a breadth of high-quality data. We believe that this creates value, not only to the service provider, but also to the industry in general. We strive to work with operators more directly to ensure that the data we are capturing are of superior quality.
Automated workflows like the one we have described can help our industry by eliminating repetitive biased tasks and enabling engineers to focus on more creative processes, such as developing new drill bit designs, material or component selections to overcome new challenges and reduce drilling time and cost for the industry.
ACKNOWLEDGEMENT
This article contains excerpts from two technical papers, including “Automated offsets for drill bit performance evaluation, analysis, and monitoring at scale,” SPE paper 212464-MS, presented at the SPE/IADC International Drilling Conference, Stavanger, Norway, March 7-9, 2023. And “Leveraging online analytical processing cubes in the world's largest offshore and land drilling record system,” OTC paper 29457-MS, presented at the Offshore Technology Conference, Houston, Texas, May 6-9. 2019.


- Advancing offshore decarbonization through electrification of FPSOs (March 2024)
- Subsea technology- Corrosion monitoring: From failure to success (February 2024)
- Driving MPD adoption with performance-enhancing technologies (January 2024)
- Digital transformation: A breakthrough year for digitalization in the offshore sector (January 2024)
- Offshore technology: Platform design: Is the next generation of offshore platforms changing offshore energy? (December 2023)
- 2024: A policy crossroads for American offshore energy (December 2023)
- Applying ultra-deep LWD resistivity technology successfully in a SAGD operation (May 2019)
- Adoption of wireless intelligent completions advances (May 2019)
- Majors double down as takeaway crunch eases (April 2019)
- What’s new in well logging and formation evaluation (April 2019)
- Qualification of a 20,000-psi subsea BOP: A collaborative approach (February 2019)
- ConocoPhillips’ Greg Leveille sees rapid trajectory of technical advancement continuing (February 2019)

