What’s new in well logging and formation evaluation
Part 2: In this final installment of a two-part series, the author highlights developments in wireline cased-hole logging, reservoir monitoring, coring, wellsite evaluation and laboratory techniques.
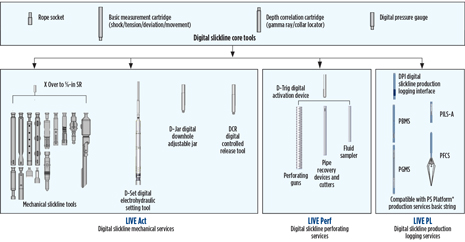
New developments in cased-hole logging include near-well acoustic imaging, digital slickline, downhole video, multi-detector pulsed-neutron logging and nonradioactive proppant mapping. New developments in well and reservoir monitoring include improvements in fiber-optic permanent monitoring systems, distributed acoustic sensing and distributed chemical sensing. New developments in coring and core evaluation include a new sponge-core system, review papers on the state-of-the-art in core evaluation, geochemical evaluation, a spectral gamma-ray core scanner, and X-ray tomography core imaging. New developments in wellsite evaluation include real-time cavings monitoring, and portable and hand-held rock analyzers. New developments in laboratory techniques include cuttings-based well-log calibration, quantitative fluid analysis and permeameters.WIRELINE–CASED HOLEAmong the five items listed in this category, two appeared in previous annual round-ups, and have had significant updates. Acoustic. The near-well acoustic imaging technique (BARS) described in World Oil’s 2013 formation evaluation roundup has been extended to imaging in cased wells.1 In a case study involving post-fracture imaging in a layered carbonate in a horizontal well, the technique provided reliable results up to 100 ft from the borehole. This technique can be used to identify reservoir features that have acoustic contrast—bed boundaries, fractures, and fluid contacts—and has direct applications in well placement and well completion in mature fields. Digital slickline. Schlumberger has developed LIVE digital slickline services, which allow real-time, two-way, digital data telemetry during intervention operations and production logging, while using standard slickline surface equipment.2 The service is based on a new slickline cable that uses a proprietary polymer coating over a standard slickline core to provide electrical insulation that enables data transmission. In addition to a core group of battery-operated tools—which includes a basic measurement cartridge, depth correlation (gamma ray and casing collar locator), digital pressure, an interactive jar and a controlled release device—a family of specialized battery-operated tools has also been developed to expand the range of slickline services, Fig. 1. Acquisition of real-time downhole data during intervention operations results in greater precision, depth accuracy, and toolstring control during these operations.
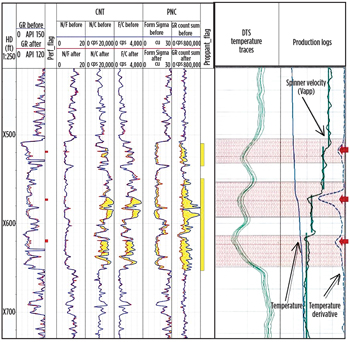
Downhole video. Downhole video is used primarily to monitor tubular integrity (corrosion or damage), fluid entry and movement (production logging),4 and to locate dropped objects, damaged tubing/casing, and wellbore fish. It also can be used for borehole imaging in barefoot gas completions. EV’s latest-generation e-line video camera—Optis Electric Line HD—uses video compression techniques and high-speed telemetry to stream high-definition (HD) color video to surface, at 24 frames/sec, in real time. Video data also can be stored in downhole memory. The camera, which uses LED lighting, can be run with downview, sideview or both. It is rated for operation at temperatures and pressures up to 125°C (257°F) and 15,000 psi (103.4 MPa), respectively. The 1.68-in. (43-mm) tool can be run on mono-conductor or multi-conductor cable. The camera can be combined with other tools—calipers for example—in a single toolstring.5 Multi-detector, pulsed-neutron logging. Weatherford’s multi-detector, pulsed-neutron, cased-hole reservoir evaluation service, Raptor, (described in World Oil in 2009) has now been commercialized.6 The tool employs four lanthanum-bromide (LaBr3) scintillator detectors and a fast-neutron detector. The use of multiple detectors in pulsed-neutron tools optimizes data acquisition, and the detector array samples a larger portion of the neutron-gamma transport field than traditional pulsed-neutron tools. This, in turn, results in greater sensitivity to formation gas, allowing improved formation characterization. The use of LaBr3 detectors on the new tool provides improved signal-to-noise ratio; greater peak resolution for better spectral analysis; greater temperature stability; and potentially faster logging speeds. The inclusion of a fast-neutron detector enables improved data quality control. The heightened gas sensitivity provided by the large detector array enables quantitative measurement of formation gas in through-tubing and dual-completion environments.6, 7 In addition to conventional sigma and C/O measurements, the tool makes two new measurements that are principally used in formation evaluation, a fast-neutron normalized burst ratio and a capture ratio. These measurements are derived from ratios of the count rates of the nearest and farthest detectors, using a generator burst-timing mode that is different from both the sigma and CO bursts. The tool can mix the different measurements in a single pass. Non-radioactive proppant mapping. Typically, the placement of proppant during hydraulic fracturing is evaluated through the use of radioactive tracers pumped downhole with the fracturing slurry. Recently, however, a non-radioactive ceramic proppant—containing a high thermal-neutron-capture compound—has been developed. It can be detected using conventional compensated- or pulsed-neutron tools. The inert taggant material is manufactured into every grain of proppant, which ensures the detection of every grain. This proppant evaluation method avoids the limitations of radioactive tracers and eliminates the potential health risks and environmental hazards associated with handling, transporting, pumping and flowing back radioactive materials. The proppant location is determined through comparisons of pre- and post-fracture logs or via a new technique that uses only post-frac logging data. The latter technique is especially useful in cases, where formation gas saturation in a zone changes between the pre- and post-frac logging, resulting in count-rate changes that are unrelated to the presence of proppant, Fig. 2.8, 9
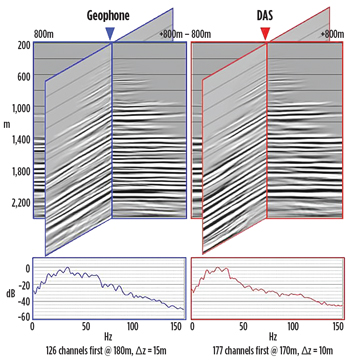
WELL AND RESERVOIR MONITORINGPermanent Reservoir Monitoring. The current state-of-the-art in fiber-optic monitoring is summarized by two recent papers.10, 11 Fiber-optic sensors use simple sensing elements that do not incorporate electrical components. They use inert materials, are highly accurate, and can operate at high temperatures and pressures. Thus, permanent well and reservoir monitoring systems that use fiber-optic sensors are more reliable, have greater design flexibility, and are more cost-effective than electrically based sensor systems. Also, once these systems are installed, data acquisition is simpler than geophone-based data acquisition. The cost of providing multiple time-lapse surveys over a well’s life is a fraction of what it would be using conventional methods. In contrast to single-point and multi-point sensors, which are positioned at discrete depths along the fiber cable, distributed sensors, e.g., DTS, take measurements along the entire length of the fiber-optic cable. Initially, point sensors were used, where high precision and fast measurements were needed, and distributed sensors were preferred, where extensive coverage was required. However, the newest sensors achieve both the precision of a point sensor and the wide coverage of a distributed sensor. Modern fiber-optic cables use pure silica fiber, which reduces or eliminates the earlier problem of hydrogen darkening, thereby increasing the lifespan and allowing operation at higher temperatures—the current generation of commercial oilfield, fiber-optic sensors/gauges is typically rated for downhole operation at temperatures up to 500°F (260°C) and pressures up to 30,000 psi (206.8 MPa). There are fiber-optic sensors capable of operating at temperatures up to 800°C (1,470°F).11 Multi-point sensors (Fiber-Bragg-Grating, FBG sensors) can be multiplexed in a single fiber to provide multiple, simultaneous measurements of different physical parameters. Fiber-optic systems are being used to monitor a variety of operations in producing wells, including sand and fluid production; water injection; compaction; well and completion integrity; real-time stimulation; and fracture-height monitoring. Shell has been one of the leaders in the application of fiber-optic sensing and has been partnering with other companies to develop new, innovative applications.12 Distributed fiber-optic systems are increasingly being installed in extreme downhole environments where intervention is difficult and costly.13, 14 There has been a lot of recent activity investigating applications of permanently installed, distributed acoustic sensors (DAS’s).10 Although, at present, DAS’s are less sensitive (have a higher noise floor) than conventional geophones,15 they provide nearly equivalent data in many applications, including geophysical vertical seismic profiling (VSP) images, in a single shot; no resetting of geophones is needed over the length of the well. At the same time, standard seismic processing techniques, e.g., stacking, can be used to improve DAS data quality (the signal-to-noise ratio), Fig. 3.
Some of the primary DAS applications are:
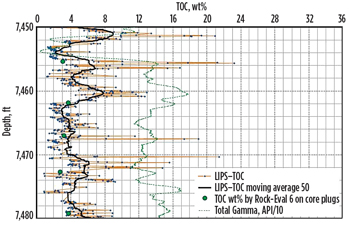
In addition to downhole use, DAS systems, in the form of ocean-bottom cables, are being considered or have undergone field tests for acquiring 4D (time-lapse) seismic data over producing fields to monitor fluid movement and sweep efficiency.12, 22-24 Another innovative application of fiber-optic distributed sensing being investigated by Shell is distributed chemical sensing (DCS), which will allow detection of specific molecules along the inflow area of producing wells.12 One approach to DCS involves the application of a chemical responsive coating on an FBG sensor. The presence of a chemical compound causes the coating to generate an axial strain in the fiber/FBG. A strain-induced wavelength shift in the FBG can provide quantitative information about the chemical composition of the borehole fluid. By applying different coatings on different FBGs, the DCS system can measure the chemical composition.11 CORING AND CORE EVALUATIONSponge core. Baker Hughes has introduced a new sponge-coring service that uses a more tightly fitting sponge liner to prevent fluid migration, and results in more accurate measurements of in-situ fluid saturation. The service provides 3.5-in. diameter cores in 30-ft lengths. Some of the improvements include a larger core diameter to enable greater accuracy in rock and fluid analysis; coring bits that more closely match the diameter of the core to the sponge for better fluid isolation and absorption; a new sponge-liner design that incorporates a mesh lining to protect the sponge and reduce core jamming, and also prevents mud contamination during the coring process; and the use of laser-cut aluminum liners has improved core handling and greatly reduced the possibility of damage to the core during handling. The service is rated to 195°F (90°C) and 15,000 psi (103.4 MPa).25 Core evaluation. Two recent review papers summarize the state-of-the-art in coring and core analysis.26, 27 Geochemical evaluation. Total has developed a new core logging pyrolysis instrument that can be used to evaluate the remaining hydrocarbon potential in organic-rich rocks at the centimeter scale. The laser-induced pyrolysis system (LIPS) performs automatic acquisition of high-resolution measurements of total organic carbon (TOC) on conventional core at a 1-cm sampling increment; the measurement acquisition time is 1 min/sample. The resulting high-density TOC data can be used to generate more accurate in-place resource estimates; to obtain more representative average rock properties for selected stratigraphic intervals; to calibrate well logs; and to help identify and target the best zones for completion. In the LIPS measurement, first a low-power laser shot is used to clean the core surface; this is followed by a second, high-energy, laser shot that pulverizes and pyrolyzes the rock and organic matter. Each laser shot focuses on a pinhead-size portion of the core and does not affect its integrity. The volatile organic compounds, oxidized and pyrolyzed hydrocarbons that are released, are transferred continuously through electrostatic filters to the photo-ionization detector (PID). Only hydrocarbons are detected—the PID is insensitive to the CO and CO2 released during the thermal decomposition of carbonates. During the first laser shot, the L1 measurement is made; the L2 measurement is made after the second laser shot. The L2 measurement is proportional to the quantity of pyrolyzed residual organic matter, i.e., the intensity of the signal increases with the quantity of organic material impacted by the laser, and is similar to the S2 peak obtained from Rock-Eval analysis. TOC measurements on a number of core plugs using conventional methods, e.g., Rock-Eval, Leco, Fisher assay, or thin section are used to calibrate the LIPS results, Fig. 4.28-30
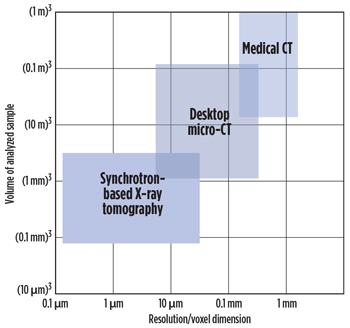
Spectral, natural gamma-ray core scanner. The Ocean Drilling Program has developed a new high-efficiency, low-background stand-alone system to provide high-resolution, spectral natural gamma-ray measurements, even in carbonate-rich rocks and sediments, which are naturally low in gamma-ray activity. The multi-detector design includes an array of eight NaI detectors, to increase count rates and minimize statistical error, and both active and passive shielding, to reduce background noise. The new equipment delivers high quality per counting time unit, which allows measurement results to meet or exceed the quality of downhole logging, significantly improving core log correlation.31 ROCK IMAGINGCore imaging. Digital-rock physics, particularly when applied to unconventional shale reservoirs, typically, involves a multi-scale imaging workflow, in which rocks are imaged using a variety of techniques—X-ray CT, micro-CT, FIB/SEM—at increasingly finer scales, from whole core, cutting and core plug to the pore and subpore scale. These images are then used to create 3D renderings of the microstructure that aid in understanding the contributions of heterogeneity, fracture density, pore types, pore connectivity, mineralogy and organic content to the petrophysical response and production characteristics. Petrophysical properties calculated at the smallest (nanometer) scale are applied to the core-plug scale, via up-scaling techniques, and also can be compared with conventional laboratory-derived data.32, 33, 52, 53 Dual-energy CT. Conventional X-ray CT uses a single energy X-ray beam to generate images, which primarily reflect variations in rock/mineral density and porosity, while dual-energy CT can provide quantitative information. Dual-energy CT is used to image whole core simultaneously, at two different energy levels, and can be calibrated and processed to provide continuous bulk density (Rhob) and photoelectric factor (Pef) or effective atomic number (Zeff) values at 0.5-mm resolution. These data, in turn, can be used to interpret porosity, organic content, and mineralogy. When the data are combined with spectral gamma data, elastic properties and brittleness index can be determined. The high-resolution bulk density and photoelectric data can identify different lithotypes, which allows improved selection of representative core plugs for use in the second level of DRP. In addition, the data can be used to calibrate bulk-density logs in washed-out intervals.34, 35 Synchrotron X-ray CT. The application of the latest synchrotron sources in X-ray tomography can significantly reduce the current limitations in X-ray micro-CT instrumentation for characterizing the microstructural details in rocks.36 The high brilliance of synchrotron radiation provides increased resolution, which allows detection of details as small as 1 µm in millimeter-sized samples. The monochromatic X-ray beam allows for quantitative measurements of material properties, such as density, as well as increased contrast and reduced noise, Fig. 5.36 Synchrotron X-ray tomography (SRXTM) can provide ultra-high-resolution 3D images of core; however, the availability of synchrotron equipment is very limited, primarily to research laboratories.
WELLSITE EVALUATONReal-time cavings monitoring. Keeping the borehole clean in high-angle and extended-reach wells is essential to prevent cuttings buildup that can lead to borehole-instability issues. Cavings provide the first and most important indicator of wellbore deterioration.37 Consequently, monitoring the volume and characteristics of cavings during drilling is an important tool used to predict the potential for wellbore instability. The prototype of a new cuttings flowmeter tool, the automatic caving-flux measurement (MAC) tool, is undergoing field tests. The tool automatically measures caving flux (flow) in real time while drilling, and the software generates information on cumulative cavings and cutting production, as well as a pseudo-caliper log of borehole geometry. The weight of cuttings/cavings is measured at defined intervals, and a calculation of rock volume is made from the estimated rock weight, Fig. 6.
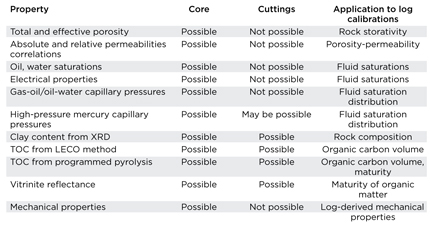
The flux calculation is based on a series of measurements. The tool is used to identify situations in which cuttings and cavings flows are high enough to cause wellbore instability. The system estimates the well’s actual diameter, based on the cutting information, and by comparing the ideal with the actual borehole diameter, which allows identification of zones, where wellbore failure may occur, as well as the approximate size of collapse.38 Portable and hand-held rock analyzers. The use of portable and hand-held devices to obtain rock elemental composition data at the wellsite continues to expand. The current generation of handheld XRF (X-ray fluorescence) devices can quickly and simultaneously determine up to 30 elements on cuttings, core, or outcrops in real time. XRF is a nondestructive technique, in which the sample is bombarded with high-energy, primary X-rays or gamma rays, thereby causing the sample to emit secondary (fluorescent) X-rays, which are detected and plotted, based on energy and intensity. The energy of the detected, secondary X-rays is unique for each element, and the corresponding intensities are converted to concentrations and reported as percentages or parts per million. Similar to the process used in geochemical well logging, sample mineralogy can be inferred from the elemental composition. The mineralogy is subsequently used to infer physical properties of the rock unit. Recent applications include chemostratigraphy39, 40 and geosteering.41, 42 Agilent has introduced the latest model (4300) in its series of battery-operated, handheld FTIR (Fourier-transform infrared reflectance) spectroscopy devices.43 This device offers a variety of sampling interfaces to provide in-situ molecular composition analysis of rocks and minerals, with little or no sample preparation. The on-board analysis software accesses libraries of both absorbance and diffuse reflectance spectra for rocks and minerals, to assist in identification of samples that have both rough and reflecting (e.g., crystal faces) surfaces. The diffuse reflectance (DRIFTS) interface is the preferred method for samples that don’t reflect a lot of light, i.e. rock samples. FTIR analysis provides information on sample chemistry, the relative amounts of minerals present, and the presence of water and hydrocarbons.44 This method has been used in the laboratory to provide rapid, cuttings-based quantitative analysis of the major parameters governing production in unconventional reservoirs, i.e., kerogen, quartz, calcite, dolomite, and clay minerals (illite, kaolinite, smectite).45 The combination of XRF and FTIR analysis provides a more complete understanding of the chemistry of a sample. XRF analysis provides information about the elements present in a sample and is more sensitive to heavier elements. FTIR analysis provides complementary information about how the elements are bonded to form the mineral’s chemical composition, and is very sensitive to most minerals composed of light elements, including all silicates. LABORATORY TECHNIQUESCuttings-based well log calibration. Core-derived rock properties data are preferred for calibrating well logs. However, core data are available for only a small number of wells, whereas drill cuttings are available for every well. A recent study evaluated the accuracy of well log analyses, calibrated by using rock-properties data derived from both core and cuttings, with analyses obtained using only cuttings-derived data. The study concluded that in the absence of core samples, a select set of cuttings-derived rock properties provides an acceptable, cost-effective alternative, in some reservoirs. Established laboratory techniques were used to obtain the cuttings-based rock properties, Table 1.46
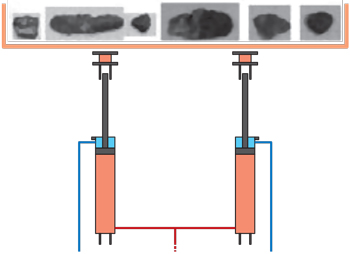
Quantitative fluid analysis. With the increasing application of advanced mud gas analysis, efforts are underway to integrate the information obtained from this technique with data acquired from downhole fluid analysis, to improve reservoir-fluid characterization (composition) and thus enable more accurate fluid and reservoir models.47, 48 Laboratory permeameters. Permeameters are used widely to measure rock permeability. Modern permeameters are designed to measure very-low rock permeability and employ the steady-state or transient-flow (pulsed-decay) methods, or both in some cases. In the steady-state design, flow is established through the sample, and the permeability is calculated from the measured flowrate and pressure gradient. However, steady-state methods are generally impractical for measuring very low-permeability rocks (< 0.1 md), because a long period of time may be required to establish steady-state flow. In the pulse-decay design, a cylindrical (core-plug) sample is connected to two fluid reservoirs. At the start of the experiment, the fluid pressure in the upstream reservoir is suddenly increased, i.e., a pressure transient is created. As the pressure transient propagates though the sample—i.e., the pressure transient decays—fluid flows from the upstream reservoir, across the sample to the downstream reservoir, and the data acquisition system records the change in pressure across the sample, the downstream pressure, and time. Permeability is calculated from a linear regression performed on the pressure time data. The current generation of pulse-decay permeameters is designed specifically to measure permeability in unconventional tight gas and shale gas formations, and tight carbonates. These devices can determine permeability in the range of 0.1 md to 10 nd. A recent paper used published data to examine common pitfalls in permeameter interpretation and to identify areas where permeametry interpretation can be improved.49 In another development, a new permeameter design incorporates temperature-compensated pressure transmitters, an advanced data logging system and modern fitting technology that allow a measurement range between 1 md and 1 nd with an uncertainty < 0.5 nd. Tests can be run at confining pressures up to 10,000 psi (68.9 MPa) and pore-fluid gas pressures up to 4,350 psi (30 MPa).50 Mini-permeameters are smaller devices that provide rapid, nondestructive and relatively inexpensive permeability values. Mini-permeameters use a probe that is pressed against the surface of a sample while flowing gas through an aperture into the sample. When the gas flowrate and pressure are judged to have reached steady-state, they are recorded, and the measurement is complete and flowrates are converted to permeability values. These devices are commonly used to take permeability measurements on a dense sampling grid on split whole core to resolve fine-scale heterogeneities not visible on CT images; they are also small enough and can be ruggedized for field use. A recent development is a non-contact minipermeameter that provides extremely fast measurements and can be used in the laboratory and in the field. In contrast to other mini-permeameters, which require several minutes per measurement, the measurement acquisition time for this new design is 5 msec; also, the distance between measured sample points can be as small as 0.04 mm versus 0.1 mm for contact mini-permeameters. The measurement can be made on any rock surface, as long as a 5-mm2 area is available below the probe.51 REFERENCES
|
||||||||||||||||||||||||||||||||
- Applying ultra-deep LWD resistivity technology successfully in a SAGD operation (May 2019)
- Adoption of wireless intelligent completions advances (May 2019)
- Majors double down as takeaway crunch eases (April 2019)
- What’s new in well logging and formation evaluation (April 2019)
- Qualification of a 20,000-psi subsea BOP: A collaborative approach (February 2019)
- ConocoPhillips’ Greg Leveille sees rapid trajectory of technical advancement continuing (February 2019)

