Global rig fleet declines in tandem with industry activity

Last year’s tumble in oil and gas prices forced U.S. rig owners to stack numerous units and downsize operations over the past year. According to the 62nd Annual NOV Rig Census, the 2015 U.S. available fleet has declined significantly, as activity levels plummet. Rig counts were tallied for this year’s census in the early summer, after almost a year of weakened commodity prices. The gap between available and active rigs widened, showing an overall, reduced U.S. market. The Canadian drilling environment also experienced a downturn in activity and availability, as a large number of rigs were removed from service.
The available rigs for the global, offshore mobile fleet remain flat, as compared to the North American offshore mobile fleet in 2015. However, there was a large number of offshore units that were built this year, due to them being in the manufacturing queue from 2014. Most international land rig counts suffered—with some significant declines in utilization over the past year.
CENSUS HIGHLIGHTS
Key statistics from the 2015 census include the following:
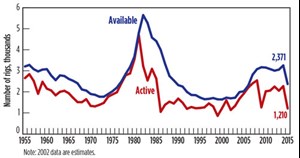
- The U.S. fleet suffered an overall decline of 883 rigs, causing the total available count to drop about 27%, to 2,371 units. This net decrease is the result of 1,120 rig deletions and 237 rig additions, Fig. 1.
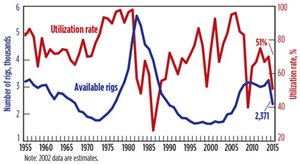
- Utilization of the U.S. fleet (combined land and offshore) declined 19 percentage points, and now stands at 51%, Fig. 2.
- Active, global, offshore mobile units fell 11%, to 647.
- Overall, international land utilization declined 10 percentage points for 2015, and now stands at 81%; however, the addition of Russia this year skewed the year-to-year comparison.
U.S. RIG ATTRITION
We define an “available rig” as one that is currently active, or ready to drill, without a significant capital expenditure. A land unit must not have been stacked for longer than three years, and for an offshore unit, the period must not be longer than five years. If it can be determined that a rig is cold-stacked, then it is removed from the available fleet. Extensively damaged rigs are also taken out of the available count.
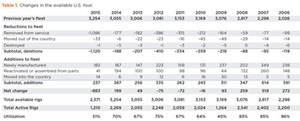
Rigs that have moved to other countries are not counted as available in the U.S.; however, they may show up in the international tally. All rigs removed from the fleet in each of these cases are totaled as “Reductions to fleet.” There was a total of 1,120 rig deletions this year, compared with last year’s 188-unit decline, Table 1.
The largest number of deleted rigs continues to be in the “Removed from service” category. This number increased from 177 units in 2014 to 1,086 this year. This category includes any units that require a large capital expenditure, rigs auctioned or cannibalized for parts, units idle for three or more years, or rigs that are cold-stacked. When circumstances call for rigs to be brought back into service, units are categorized as “Reactivated or assembled from parts” in the U.S. Rig Additions part of this article.
We attempt to track rig movements, in and out of the U.S. There were 33 rigs exported this year, which is more than the six units that left the country in 2014. These units are classified in the “Moved out of the country” category. Rigs coming into the U.S. are covered in the U.S. Rig Additions section below.
Rig accidents occasionally occur, and equipment may sustain irreparable damage. Irreparably damaged rigs are classified “Destroyed.” Only one rig was classified in this category for 2015. This compares with five rigs that were counted as destroyed in the 2014 census.
U.S. RIG ADDITIONS
Rig building programs continue to produce new units, because they were ordered before commodity prices fell. With weakened market conditions and newly manufactured rigs available, fewer older rigs have been needed. However, there are always some rigs that fall into the category of “Reactivated or assembled from parts.” In addition, there are usually a few rigs that enter the U.S. from other countries. Census figures show that 237 rigs were added to the fleet over the last year, compared to 387 units for 2014, which is a 39% drop. These new additions did offset some of the 1,120 deletions to the fleet mentioned previously, Table 1.
The number of U.S. newbuilds was essentially the same for 2015 and 2014 with 182 and 187 new units being counted, respectively. The average age of rigs in the fleet is now much lower, with more than 2,100 new units entering the fleet over the past decade. The rigs entering the fleet are more efficient and cost-effective—qualities especially needed in today’s market.
The number of U.S. rigs that were “Reactivated or assembled from parts” dropped significantly in 2015. This year’s count came in at 41, while 193 units were brought back into service during 2014. Most of the reintroduced rigs were counted in prior censuses but had been out of commission. A few may have been assembled from cannibalized parts to create new units.
Fourteen rigs that “Moved into the country” are counted as additions to the census. This is up from the six rigs that moved into the U.S. during 2014. There was a net export of 19 rigs, with 14 units moving in and 33 moving out.
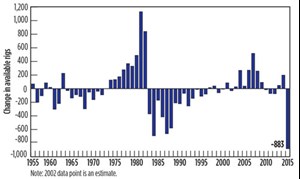
With a total of 237 rig additions and 1,120 rig deletions, the net change in the fleet over the past year was an 883-unit decline (down 27%). This compares to a fleet increase of 199 units in 2014, Fig. 3. The U.S. fleet now has 2,371 available rigs.
CANADIAN FLEET
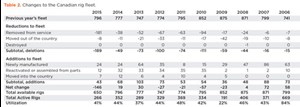
The available Canadian fleet had a noteworthy drop in rigs for 2015. The number of rigs removed from service increased, as many tracked rigs were taken out of commission. Newly manufactured rigs remained the same, but reactivated rigs were lower. Losses outpaced gains, and the available fleet size fell.
Rigs “Removed from service” continue to be the primary cause of Canadian fleet attrition. This includes land rigs idle for more than three years, and offshore rigs idle for more than five years, as well as those that might require a considerable capital outlay. There were 181 rigs classified in this category, which were dropped from the census available count. This compares with just 38 rigs that were removed from service in 2014.
Eight Canadian rigs were taken out of the 2015 census, due to being “Moved out of the country.” This was slightly lower than the 11 units that relocated last year. Most of these rigs were headed to the U.S. market. No Canadian units were reported as “Destroyed” over the past year. The sum of all deletions totaled 189 units in 2015.
The number of “Newly manufactured” rigs entering the Canadian fleet this year was 24 units for a second year in a row. These new rigs were ordered prior to the downturn in commodity prices. Rigs “Reactivated or assembled from parts” declined, once drilling became less profitable. Just 12 units were brought back into service in 2015, versus 32 in 2014. Seven rigs were “Moved into the country” for Canada, while eight units were “Moved out of the country.” There were 43 additional rigs, and 189 units deleted this year, which caused the Canadian available count to drop 18% to 650 rigs, Table 2.
GLOBAL OFFSHORE MOBILE FLEET
Rig-building continued this year, and it was the dominant reason that rigs were added to the global offshore fleet. In addition, a few rigs were reactivated. However, overall attrition was higher than last year, offsetting all gains to the fleet.
All reductions this year came from 50 rigs that were “Removed from service.” This compares to 22 rigs that were retired in the 2014 census. No rigs were reported as “Destroyed,” due to accidents, versus three units that fell into this category last year, Table 3. If an offshore rig has not worked in the past five years, and does not have a contract, it is removed from the available count until this status changes. This prevents rigs that cannot be reactivated quickly from being counted. Although the census tracks the majority of platform and inland barge rigs in the U.S., these statistics are difficult to obtain on a worldwide basis. Therefore, the global mobile offshore statistics do not include these types of units.
There are 48 new offshore rigs that have come online since last year. The rate of increase in the fleet has been fairly consistent for the past seven years, with 40 or more rigs being added each year. According to our sources at IHS, by mid-2016, another 110 units are scheduled for delivery. In addition to the 48 newbuilds this year, three offshore rigs were “Reactivated or assembled from parts,” bringing the total additions to 51.
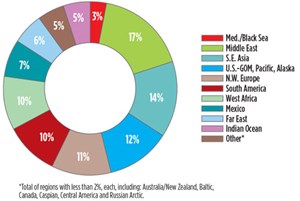
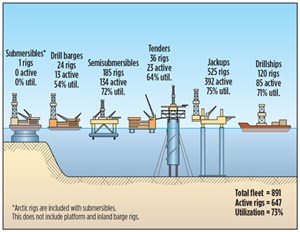
The available count for the global offshore mobile fleet now stands at 891 units. Despite the industry downturn, the fleet managed to achieve a net increase of one rig and set a new high for the number of available rigs recorded. The worldwide offshore mobile fleet is widely distributed, with the Middle East remaining in the lead, followed by Southeast Asia and the U.S., Fig. 4. Fleet composition by specific rig type is shown in Fig. 5.
U.S. ACTIVITY
Active rig counts are an indicator of oil company exploration and development, and can also show how confident producers feel about the drilling environment. Drilling activity in the U.S. had picked up considerably in 2014, only to fall sharply in 2015 after commodity prices fell. Active rigs numbered just 1,210 this year versus 2,269 last year, equal to a 47% decline in activity. The gap widened between available and active rigs, reflecting the industry downturn.
The methodology used to count active rigs for the NOV census is different from other published rig counts. The NOV census counts a rig as active, if it has drilled at any time during a defined 45-day period in the late spring. For 2015, the window of activity was May 6 thru June 19. Most other published rig counts look at weekly activity. When a longer period is monitored, a larger pool of working rigs will be counted. The methodology that we use can be a better indicator of drilling activity during that timeframe, since fewer active rigs will be left out, due to rig movements, alone.
Rig utilization, the ratio of active to available rigs, is a statistic that shows the demand/supply balance. This year, U.S. utilization has fallen severely and is now just 51%, compared with 70% in 2014. By our records, this the lowest utilization level seen since 2009.
There are 1,161 available U.S. rigs that were idle during this year’s 45-day census period. Most of these units are waiting for contracts. These inactive rigs were classified according to the length of time that they have been idle. Rigs stacked less than one year equaled 987; one to two years, 93; and two to three years, 81. Census rules state that land rigs stacked more than three years, and offshore rigs stacked more than five years, are removed from the available fleet.
Full-year utilization is the ratio of active to available rigs that drilled at any time during the past year. This is another statistic used to measure overall fleet dynamics. Adding the 1,210 active rigs to the 987 rigs stacked less than one year provides the total number of rigs that drilled between the end of the 2014 census and the end of the 2015 census. This full-year utilization figure indicates that rig owners used 2,197 (or 93%) of all available rigs during the past 12 months. This utilization figure is much higher than the utilization for the 45-day active period, since it takes mid-2014 into account, before commodity prices fell.
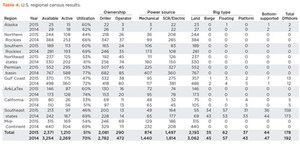
Census results for the U.S. are also calculated by region. All U.S. regions had decreases in available rigs for 2015, which is a reversal from 2014, when most regions showed increases. Rig activity also was down in every region for 2015. The year-to-year breakdown for 2014 and 2015 is shown in Table 4. The regions hit the hardest this year were the Northern Rockies, where available rigs fell 36%, and the Southern Rockies, where available rigs were down 33%. Utilization figures also dropped in all other areas, with the most severe declines occurring on the Gulf Coast (down 25%), in the Permian basin (a loss of 24%) and in the Southeast States (a drop of 23%).
The regional figures above are a combination of land and offshore statistics. When looking at total U.S. land rigs, the utilization declined to 52%. In 2014, the utilization rate was 70%. The U.S. marine fleet during 2015 also had a considerable utilization drop to 41%, versus 69% last year. Demand for offshore rigs, by type, varied greatly, with floating rigs having the highest utilization at 63%, and inland barge rigs the lowest at just 20%.
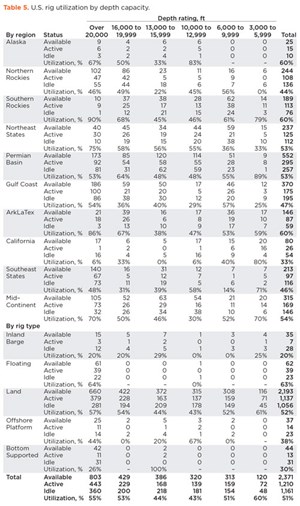
Differences were not quite as wide when analyzing the U.S. land and offshore rigs by depth capacity. The rigs with the highest utilization are now the shallow rigs (3,000-to-5,999-ft range) at 60%, while the lowest are those in the 13,000-to-15,999-ft range at 44%, Table 5.
CANADIAN ACTIVITY
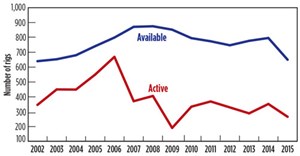
Year-to-year statistics for Canada have fluctuated with commodity prices and the timing of the spring thaw, when rig moving is restricted in environmentally sensitive areas. Canadian rig activity declined 18%. After having surged to 352 active rigs in 2014, the active count was just 266 units during the 45-day window of May 6 to June 19. Since both available and active rigs fell at similar rates in 2015, utilization declined just three percentage points to 41%, Fig. 6.
Segmenting the Canadian fleet by depth capacity, 32% of available rigs are rated between 6,000 and 9,999 ft, followed by 27% of units rated between 10,000 and 12,999 ft. Utilization by depth capacity shows that those with ratings greater than 20,000 ft. have the highest utilization. Some major players are shifting focus to the long-reach horizontal market, where deeper-rated rigs are required.
INTERNATIONAL RIG UTILIZATION
International utilization is categorized by regional areas. This year, Russia was added to the European total, and consideration should be made when making year-to-year comparisons. In Russia, the market is estimated at just under 800 active drilling rigs and is essentially fully utilized. The inclusion of Russia has propped up Europe’s utilization numbers for 2015, and thus utilization remains at 96%. Although sanctions against Russia have not impacted that country’s drilling activity, it is anticipated that sanctions may greatly affect future development. In Western Europe, drilling continues to be flat, as operators continue their departure from areas like Poland.
For Africa, utilization is reportedly higher in some areas like Algeria. However, these additions did not overcome the drop from lower oil prices in the region. Overall, land rig utilization in Africa came in at 75% for 2015, compared to 87% in 2014.
While the number of active rigs for Asia remained almost identical to last year’s census, idle capacity in the region grew considerably, as many rigs are stacked while weathering the industry downturn. Consequently, this deflated utilization is down to 67% for 2015, after having been 86% last year.
Despite the market downturn, steadier activity remains in the international land markets. The Middle East and OPEC leader, Saudi Arabia, remains in the lead, with the most active rigs in the region, as the country continues to keep production levels high. Utilization only dropped to 99% from 100% last year.
Latin America was one of the main areas of movement for rig utilization, falling to 67% from 84% last year. The market in Argentina maintains high rig counts, year after year, as it continues to ramp up shale development, Table 6.
The availability of international rig count information varies greatly on a country-by-country basis. So, for the past decade, we have gathered worldwide rig counts to estimate utilization by region. Utilization figures are most likely higher for the NOV count than estimates from other sources.
GLOBAL OFFSHORE MOBILE ACTIVITY
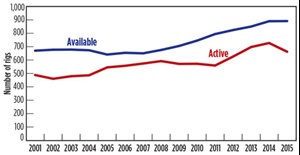
The activity level for the global offshore mobile fleet experienced a downturn for 2015, with 647 rigs running, which is a decrease of 78 units or 11%. At 725 rigs running during 2014, last year’s figure was the highest number of active rigs recorded for the global offshore mobile fleet since statistics started being kept in 2001. With the exception of platform and inland barge rigs, all offshore mobile units are included in these figures. The spread between active and available rigs also widened this year, causing fleet utilization to fall from 81% in 2014 to 73% during 2015, Fig. 7.
U.S. INDUSTRY TRENDS
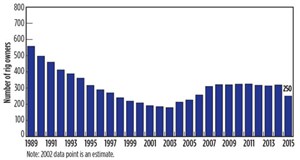
The number of rig owners holding available units is also tallied. In recent years, the number of owners had leveled off somewhat, with the number of new drilling companies added typically balancing closely with the number of companies ceasing operations. For 2015, the net number of rig owners declined considerably. Company closures, mergers and acquisitions, and large numbers of rigs being stacked all contributed to a net reduction of 69 companies this year. The total number of rig owners declined to 250, compared with 319 last year, a drop of 22%, Fig. 8.
In the 2015 census, drilling contractors own 88% of all U.S. drilling rigs, and operators own the remaining 12%. This is a marginal increase from 2014’s breakout.
U.S. FORECAST FOR 2016
If you’ve been in the oil and gas industry for any length of time, you’re familiar with its boom-and-bust nature. As of this writing, oil prices have been especially volatile. By the time this article goes to press, commodity prices are anyone’s guess. Even during hard times, rig owners are a resilient group. This attitude is evident in our survey results, both in rig owners’ short-term forecasts and long-term company plans, since many predict better days in 2016 and beyond. And even as prices have fallen, production levels have remained high. In addition, the demand for state-of-the-art rig technology hasn’t waned, and rig building isn’t over yet. ![]()
ACKNOWLEDGEMENT
NOV partnered with several companies to collect industry statistics. IHS Drilling Data and RigData are the primary sources used for the U.S. land rig fleet, and the global offshore mobile fleet. Information for some areas, particularly the international fleet, was collected and analyzed by NOV personnel. The following individuals are recognized for their specific contributions to this year’s rig census: Tom Kellock (IHS); Jacoby Garcia (RigData); and Keith Joseph, Dustin Roy, Heather Shelton and Amanda Parks (NOV).
- Applying ultra-deep LWD resistivity technology successfully in a SAGD operation (May 2019)
- Adoption of wireless intelligent completions advances (May 2019)
- Majors double down as takeaway crunch eases (April 2019)
- What’s new in well logging and formation evaluation (April 2019)
- Qualification of a 20,000-psi subsea BOP: A collaborative approach (February 2019)
- ConocoPhillips’ Greg Leveille sees rapid trajectory of technical advancement continuing (February 2019)

