U.S. oil reserves fall for first time in seven years
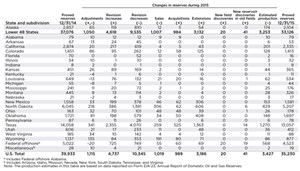
According to the U.S. Energy Information Administration (EIA), U.S. crude oil and lease condensate proved reserves dropped 4.7 Bbbl in 2015. This represents an 11.8% decline, from 39.9 Bbbl to 35.2 Bbbl. This was the first drop in crude oil and lease condensate reserves since 2008.
Proved reserves are estimated volumes of hydrocarbons that analysis of geologic and engineering data demonstrates, with reasonable certainty, are recoverable under existing economic and operating conditions, EIA says.
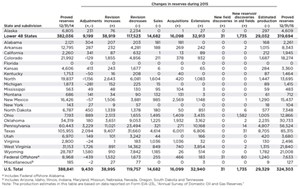
Total U.S. natural gas proved reserves—including natural gas plant liquids—also took a dive, decreasing 64.5 Tcf. This is a decline of 16.6%, from 388.8 Tcf in 2014 to 324.3 Tcf in 2015. The slump in prices—which created a more challenging depiction of existing economic and operating conditions that are considered in the classification of proved reserves—are to blame for U.S. producers’ downward revisions, EIA says.

The decrease in U.S. reserves, in conjunction with the increase in U.S. production (U.S. production of total natural gas increased for the tenth consecutive year, up 4% from 2014), can best be explained through the correlation between commodity prices—average price of oil in 2015 fell 47%, while the average price of natural gas fell 42%—and/or operating costs, and proved reserves that are deemed economically recoverable. According to EIA, the life of producing wells can be cut short, and planned offset wells can be cancelled or suspended, due to a decline in prices or a rise in operating costs. This “may reduce the estimate of proved reserves, even if production is increasing (usually because of a large number of new wells drilled and completed prior to the price drop/cost increase).”
Crude oil and lease condensate reserves. While Texas boasts the largest proved reserves in the U.S., it also shows the largest decline. The state’s proved reserves saw a net decrease of 1 Bbbl from 2014 to 2015. This represents a 7% decline. While field extensions added substantial reserves in the Wolfcamp and Eagle Ford shale plays, net downward revisions counteracted them.
In the Bakken shale, North Dakota showed the second-largest proved reserves. Likewise, the state showed the second-largest decline in 2015—a net decrease of 838 MMbbl (14%) of crude oil and lease condensate proved reserves.
Conversely, the Permian basin saw an increase in proved reserves in 2015. Despite an overall decline in the Lone Star State, the Texas Railraod Commission (RRC) reported that Texas District 8 added a net 681 MMbbl of proved reserves. This increase is a result of field extensions in the Permian basin.

New Mexico added another 23 MMbbl of proved reserves. This was the largest net increase in proved reserves of all 50 states in 2015. This is, in large part, due to development of the Wolfcamp shale play, as well as producing stacked formations, including the Bone Spring carbonate, the Strawn sandstone and the Avalon shale.
Tight oil. As of Dec. 31, 2015, tight oil plays accounted for 33% of U.S. crude oil and lease condensate proved reserves, 93% of which came from the six main tight oil plays. The Bakken/Three Forks formation in the Williston basin continues to rank as the top oil-producing tight play in the U.S.
Natural gas reserves. Texas, once again, had the largest natural gas reserves, as well as the largest net decrease. In 2015, Texas saw a decline of 20.6 Tcf. Oklahoma and Pennsylvania—the states with the second- and third-largest natural gas proved reserves, respectively—had significant net downward revisions, as well. The drops, however, were offset by developments in the Marcellus and Woodford shale plays. These equalizers reduced the overall decline to 3.9 Tcf and 3.6 Tcf, respectively, in 2015. West Virginia, a top U.S. gas reserves state, reported the second-largest net decrease of 9.3 Tcf.
In contrast, Ohio added more than 5 Tcf of proved gas reserves in 2015. This can be attributed to development of the Utica/Pt. Pleasant shale play in the eastern part of the state. According to EIA, Ohio bested Arkansas and the federal Gulf of Mexico as the state with the ninth-largest volume of proved gas reserves. ![]()


