What’s new in well logging and formation evaluation
This review is based on published technical papers and publicly available literature. The author does not endorse or promote any particular technologies or service providers. The logging systems may be available as commercial services, or still in development and testing phases. Due to space limitations, only a fraction of the new technologies that have been discussed in published literature can be presented here.
In 2017, the big news in the logging and formation evaluation industry was the completion in July of the successful merger of Baker Hughes and GE Oil & Gas to form BHGE, which comes on the heels of the unsuccessful effort by Halliburton to purchase Baker Hughes in 2016.
Several notable texts and reference books on logging1 and petrophysics,2,3 as well as significant review papers on a variety of topics, have been published recently. These include porosity,4 pore structure characterization in tight sandstones,5 quantitative image analysis,6 laboratory measurement of low-permeability unconventional gas reservoirs,7 and permeability standards for tight rocks.8
Depth measurement. Depth is the fundamental and critical measurement that ties all downhole data together, yet the best methods for ensuring accurate depth measurements in all borehole conditions and at all well inclinations, are still evolving (see 2014 and 2016 articles). Several recent papers discuss best approaches/practices for obtaining the most accurate depth measurement in wireline9,10 and LWD11 operations, where wireline stretch and thermal elongation of pipe may significantly impact the accuracy of the depth measurement.
LOGGING-WHILE-DRILLING
Wellbore position/survey accuracy. This is another topic that is continually evolving. As discussed previously (see 2016 article), obtaining accurate MWD surveys in high latitudes (e.g., Barents Sea) is difficult, due to time-dependent variations in Earth’s magnetic field. The magnetometers and accelerometers used in MWD tools are affected by Earth’s magnetic field, which changes with location—the main magnetic field increases in intensity and inclination toward the magnetic poles—and also over time.12 Magnetic-field corrections are based on the fundamental earth geomagnetic model used.
Baker Hughes recently introduced the CHAOS-X geomagnetic reference model to provide high-resolution global vector magnetic field estimates of earth’s magnetic field, to improve the precision of magnetic directional surveys.13 Several new correction methods to improve survey accuracy and wellbore positioning have been proposed.12,14 Accurate well positioning is particularly important in well collision avoidance15,16 and for electromagnetic ranging techniques used to intercept wells.17
Microsensor logging systems are miniature self-contained measurement devices developed to provide cost-effective, near-real-time distributed measurements of downhole parameters, such as temperature and pressure, along the length of the borehole. Microsensors are introduced into the drilling fluid by different methods but return to the surface in the circulating fluid and are trapped at the shale shakers. Two concepts have been discussed, one of which has undergone field tests. These while-drilling “logging” systems consist of (1) high-precision temperature or pressure sensors in integrated circuits on a microchip that also includes microprocessor, memory, transmitter and receiver circuits, and a rechargeable battery, and (2) a surface data collection device and an initiator.
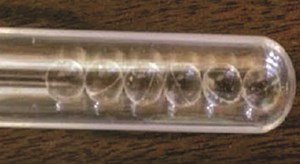
In one system, developed initially as a student thesis at the University of Tulsa, the sensors are approximately 7.5 mm in diameter, encapsulated in a spherical protective shell (Fig. 1), and have accuracies of ±60 psi and ±1.8°F, respectively.18,19 The sensors are introduced into the drilling fluid, using either a tracer injection system or by dropping them into the drill pipe during a connection and then travel through the drill pipe, out the bit nozzle, and back up the annulus to surface as the mud circulates.
The logging measurements are recorded sequentially with a timestamp, and the measurement depth is calculated using the timestamp and mud flowrate. When the sensors reach the surface, a device communicates wirelessly with the microchip to download the stored data and reset the circuit for another trip. Potential applications for these microchip sensors include optimizing cementing evaluation and locating fluid-loss zones.
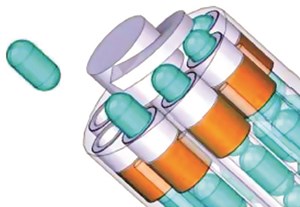
In the Sintef Digital microsonde (µSonde) system, which is still in the conceptual stage, microsensors contained in capsules are released at the bottom of a well, and record downhole parameters as fluid circulation brings them to surface.20 In drilling wells, the µSonde storage magazine (Fig. 2) is deployed together with the bottomhole assembly, whereas in production wells, a storage magazine carrying the microsondes is deployed to the bottom of the well at any time during the life of the well. The sondes are released, based on predetermined well conditions and/or time intervals and activated at launch. They continuously record measurements to memory, and at surface, the recorded data are transferred wirelessly for analysis.
Measurement depth is estimated from a combination of the elapsed time until capture, analysis of the accelerometer data, and well features recognized by analyzing the different measurements. The effective density of the sondes can be matched to the well fluid, and sondes using other sensor types (e.g., acoustic, three-axis accelerometer/gyro/magnetometers) could be constructed to meet different needs. Applications might include well integrity analysis, hole cleaning, borehole instability and lost-circulation zones.
HPHT triple-combo. Weatherford introduced a new HPHT LWD service (HeatWave Extreme, HEX) for wells encountering extreme bottomhole temperatures and pressures. The LWD triple-combo service was developed jointly with Chevron specifically for use in the Gulf of Thailand. The service, which was developed in two phases (see World Oil, March 2016, p. 55), employs completely redesigned components (including electronics and sensors) that have eliminated the need for cooling trips during extended runs at high BHT. The triple-combo service includes gamma ray, compensated dual-frequency resistivity, thermal neutron-porosity and density measurements.
The resistivity tool has two transmitters and three receivers (20-, 30-, and 46-in. spacing) and operates between 200 kHz and 2 MHz. A conventional Am-Be chemical source is used for the density measurement. The MWD system provides borehole azimuth and inclination, and borehole and annular pressure (for ECD determination). The service is rated for up to 200 hr of operation at 392°F and 30,000 psi.21
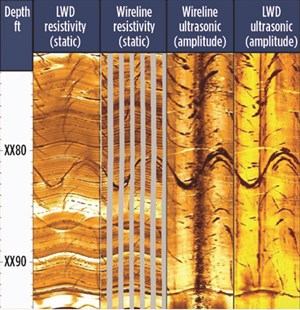
Borehole imaging. Baker Hughes has tested a new high-resolution-while-drilling ultrasonic pulse-echo borehole-imaging tool for use in all borehole fluids. New transducers were designed to achieve an adequate signal in difficult borehole conditions, (e.g., heavy OBM and soft formation or rough surfaces with low reflectivity) and provide wide bandwidth to provide accurate time-domain response. The tool sampling rate is sufficient to fully sample the borehole in the typical rates of penetration (200 ft/hr) and rpm (80 to 180) ranges experienced while drilling. Figure 3 compares images from the new tool with those from wireline imaging devices. The initial tool was implemented in a 6¾-in. collar and is rated to 329°F.22
Fluid sampling-while-drilling. Baker Hughes introduced an enhancement of its existing sampling-while-drilling service (FASTrak HD), and an advanced fluid analysis and sampling-while-drilling service (FASTrak Prism). The new tool can collect up to 16 discrete single-phase representative fluid samples per run—a total 13.4 liters of total fluid—resulting in significant rig time reductions and cost savings. Continuous measurement and analysis of pumped fluid during sampling operations makes it possible to acquire samples with minimal contamination.
In addition to the existing optical sensors, the new advanced fluid analysis service adds spectrometry in the visible-to-near-infrared range and fluorescence measurements to distinguish between fluid types.23 The new spectrometry module consists of 13 optical channels, six of which are assigned to the visible range (400 to 800 nm) and seven channels to the near-infrared range (1,400 to 2,000 nm). A spectrum of the fluid pumped (oil, gas and water) can be obtained by using a series of wavelength-selective detectors, which allows improved fluid identification and a more accurate fluid analysis.
Since crude oil components exhibit strong fluorescence and the spectrum of emitted light is characteristic for specific components, a fluorescence measurement allows the content of these different components to be determined and used to distinguish between an OBM and formation oil. The fluorescence measurement has proved to be the best indicator of cleaning up from OBM-filtrate towards oil.
Schlumberger’s new fluid-sampling and analysis service (Spectrasphere) provides laboratory-quality while-drilling fluid analysis: downhole fluid composition, fluid typing, fluid fractions and gas/oil ratio. The service is suited to high-angle and extended-reach wells, where newly designed stabilizers can be placed between the modules and repositioned, depending on the well profile, to reduce the risk of sticking. The service comprises three modules: (1) a pre-test probe, (2) a fluid mapping module, and (3) a sample carrier module.
The pretest probe provides accurate measurements of formation pressure and mobility to determine the best reservoir interval to test. It can operate as a stand-alone formation-pressure-while-drilling tool, or in combination with the other two modules for fluid typing and sampling operations. The fluid-mapping module includes a pump-out module and one or two downhole fluid analyzers (DFA), each of which includes an optical spectrometer, resistivity cell, and temperature cell. The DFA uses visible and near-infrared spectrometry data to provide sample contamination estimation, fluid resistivity and temperature, fluid typing and compositional analysis, and in-situ GOR measurements.
Sampling operations can be driven at a constant rate or constant drawdown pressure. The sample carrier module can acquire up to 12 PVT-grade fluid samples in a single run. The sample containers are mounted on the outside of the driller and protected by removable shields. The service modules are available in a 6¾-in. drill collar and are temperature-and-pressure rated to 302°F and 25,000 psi, respectively.24
Kick detection. The DOE National Energy Technology Laboratory (NETL) has patented, and is seeking to commercialize, a method using LWD/MWD instruments to detect kicks at the bit. This approach would leverage data from standard and cost-effective LWD technologies to provide early and low-cost kick detection. The concept is that highly sensitive LWD/MWD instruments can be refocused to detect drilling fluid in the wellbore. The method evaluates the LWD, using a suite of filters and algorithms to monitor wellbore conditions near the bit in real time. Because the physical properties (e.g., density, resistivity, and velocity) of this fluid are well characterized by the driller, detection of significant changes in these properties caused by the mixing of formation fluids could indicate that formation fluid influx (kick) has occurred downhole. This information could then be provided to the driller earlier than conventional kick-detection methods, enabling remedial action before the kick arrives at the surface.25,26
OPENHOLE WIRELINE LOGGING
Through-the-bit logging. Schlumberger’s ThruBit has introduced two new tools to the suite of available services, a high-resolution laterolog array tool and a microelectrical imaging device. These 21/8-in. diameter tools are deployed through a 2½-in. opening in the center of a specially adapted PDC bit. The laterolog array tool (LAT) , which has the same architecture and 12-in. vertical resolution as the larger-diameter wireline LAT, can be run in borehole diameters between 3- and 16-in., while the imaging tool is designed for borehole sizes ranging in size from 5½-in. to 9¾-in. Both tools require conductive mud systems (the imaging device requires WBM), and are fully combinable with other through-bit services. They are rated to 300°F and 15,000 psi. Due to the nature of the deployment, the LAT is run without centralizers and may require eccentricity corrections, particularly in horizontal wells.27
The through-bit imaging tool was designed specifically for horizontal well applications. It uses a 12-arm bowspring design that provides 0.2-in. spatial resolution and achieves 76% borehole coverage in a 6-in. borehole. Images are acquired in memory mode. The tool design and conveyance method required new and tool-specific data processing methods.28
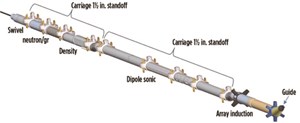
Roller and holefinder system. Petromac introduced a new conveyance system to assist logging in high-angle wells (up to 80°). The system comprises a newly designed holefinder and roller device that can accommodate the full suite of mandel-type logging tools, Fig. 4. The holefinder (guide) is angled and tapered to allow it to readily pass over ledges or other obstructions in an open borehole. The roller device (carriage) fits over the exterior of the logging tool housing and is secured to the logging tool at regular intervals (3 to 4 m) along the toolstring. The carriages, which use large-diameter narrow wheels and low–friction bearings to minimize drag and differential sticking, come in centered and eccentered models to optimize the logging tool measurements. In combination with a tractor device this system can be used to log horizontal wells.53
Gamma-ray tool calibration. Since 1959, the API formation maintained by the University of Houston has defined the API unit to which wireline natural gamma-ray tools are calibrated. However, the borehole at the UH calibration facility is too narrow to accommodate large collar-size LWD tools. Consequently, there have never been standards or recommended practices for characterizing LWD gamma-ray tools that do not fit into the test borehole.29 This has resulted in uncertainty on how to compare wireline and LWD gamma-ray measurements.
However, the university is planning to develop the real estate around the test borehole, and it will soon be unavailable for testing. Two recent papers proposed modeling-based approaches to replace the facility by varying the borehole size to match the tool OD being calibrated, and thus accommodate wireline and LWD tools.
One approach uses a combination of computer modeling and a single experimentally determined calibration point and an uncased “digital API formation” that emulates the UH formation. This method provides improved agreement between wireline and LWD logs, because they are all calibrated in the same formation and in their natural logging positions.30 This model matched the sensitivity of a wireline tool calibrated in the UH formation to within 1%; the modeled sensitivity of an LWD tool compared favorably to the measured sensitivity determined with granite blocks. The second modeling approach uses accurate nuclear and formation parameters representative of the UH facility, and tool geometry.29
NGD vs. GGD porosity measurements. This article has covered the ongoing debate on the comparison of porosity derived from the new sourceless density measurement (neutron-gamma density) and porosity derived from conventional density measurements acquired using a radioactive chemical source (gamma-gamma density), (World Oil, June 2013, p. 77 and March 2015, p. 57) see 2013 and 2015 articles). A theoretical sourceless tool was designed at the University of Texas that optimized source-detector spacing for maximum accuracy. Synthetic examples demonstrate that the accuracy of the tool design for resolving formation density in clean and shalely formations, high-density formations, and gas-saturated formations is similar to the GGD density, and the measurement remains stable for porosity estimates within ±1 porosity unit.31
Resistivity logging. Researchers at the Colorado School of Mines discussed the theory of a coincident-loop transient induction wireline tool. In contrast to conventional frequency-domain induction tools, this device would use the time-domain electromagnetic method The proposed coincident loop sounding eliminates the need for a physical separation between transmitter and receiver, as well as bucking (focusing) coils. If the correct time gates are chosen for a measurement, this method would be effective in determining formation resistivity in the presence of shoulder beds, borehole fluids, and invasion.32
Researchers at IPGG SB RAS have tested a prototype high-resolution multi-frequency device to study resistivity anisotropy and thin-bed evaluation. This “excitation-observation” system excites an alternating electric field with both vertical and horizontal components in the surrounding formations. The signal received by the toroidal receiver coils is a function of both the vertical and horizontal conductivity of the formations surrounding the borehole. Both the summary and differential excitation modes are used to increase the spatial resolution. The prototype tool includes a telemetry module and a sensor section.
The sensor section, which is split into an insulator and a transmitter-receiver section, comprises a nonmagnetic metal stem and two toroidal transmitting coils on either side of three toroidal receiver coils, Fig. 5. The coils are placed symmetrically, with respect to the center of the tool, and the length of the probe is 1.2 m. The close spacing of the T-R coils enables the high vertical and radial resolution. Operating frequencies range from 5 to 500 kHz.33
CASED-HOLE LOGGING
Cement evaluation. Ensuring well integrity requires accurate cement-bond evaluation, which in turn requires good acoustic coupling between the cement and the casing. There are two parallel approaches for accomplishing this: (1) improving the cement bond (adhesion strength) with the casing; and (2) improving cement-bond evaluation in the presence of debonding via new tools and interpretation models.
In the first category, a variety of chemical agents, including surfactants and expansion agents, have been suggested as additives to the cement or spacer to improve acoustic coupling. Two recent papers have proposed latex,34 as well as a combination of an optimized surfactant and mud-removing fiber.35
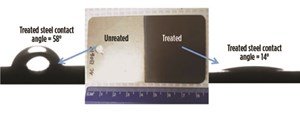
In parallel with these efforts, other methods have investigated modifications to the casing outer surface to improve casing-cement adhesion. Grit blasting, which removes mill varnish and leaves a rougher surface that improves bonding, is one such method. However, newer carbon-steel casing is naturally hydrophobic and resists cement bonding. Shell, in collaboration with Oceanit, has created a new steel-cement interface nanobond (SCIN) that uses a patented technology to create a surface morphology on the outside of grit-blasted casing that is hydrophilic (the process changes the wettability of the steel surface) and chemically reactive to cement, Fig. 6. Field tests demonstrated that in certain conditions, this process can improve acoustic coupling (i.e., cement-bond evaluation), even after multiple thermal and pressure cycles.36
Ongoing research efforts to improve the quality of cement evaluation have investigated the use of additional acoustic modes, e.g., slow Stoneley wave37 and shear horizontal.38 Another study proposed using a combination of ultrasonic and sonic logging data, in a new processing method, to distinguish between wet and dry microannulus.39
A recent paper proposed the concept for an electromagnetic cement-evaluation method, using a multi-sensory magnetic-susceptibility-type tool and magnetic cement slurries. The modeling study suggested that creation of microannulus, with accompanying contamination of the magnetic cement slurry by drilling fluid, would reduce the magnetic permeability of the cement slurry. By monitoring magnetic field strength, the proposed EM tool could, in theory, distinguish variations produced by debonding between the casing and cement.40 A review of recent trends in use of cement-evaluation logging technologies discussed the potential for oxygen activation, neutron-neutron and X-ray logging —technologies that heretofore had not been used for this purpose.41
Pulsed-neutron logging. After extensive field-testing, Weatherford launched its new cased-hole evaluation system (Raptor 2.0). The tool employs a five-detector array and four spectroscopic gamma-ray sensors that allow the tool to provide formation evaluation, production, logging, and well-integrity measurements. The larger detector array increases tool sensitivity, as well as the tool’s depth of investigation. The lanthanum-bromide gamma-ray sensors have improved peak resolution and signal-to-noise ratio, which increase the tool’s sensitivity to gas saturation and enable dimensional oil-saturation measurements. The tool uses enhanced sigma and carbon/oxygen modes for oil-water saturation in saline and freshwater formations. The tool can identify the locations and volumes of bypassed oil and gas, and can identify and correct for carbonate lithology and cementation effects.
The unique N-Vision mode is capable of quantifying gas-liquid saturation at porosities as low as 5%. An oxygen-activation mode is used for production and well integrity operations. New software workflows provide integrated petrophysical characterization. The 111/16-in. tool can be run in all mud types and is suitable for borehole diameters ranging from 2 to 18 in. It has a 12-in. vertical resolution, a depth of investigation ranging from 7.6 to 15.8 in., and is rated to 300°F and 20,000 psi.42,43
Pipe integrity. Halliburton has introduced a new electromagnetic corrosion inspection service (Electromagnetic Pipe Xaminer V) that can quantify metal loss in up to five concentric strings of pipe. The frequency-domain induction tool has two low-frequency multifrequency transmitters (up to 16 frequencies between 0.5 and 100 Hz) and eight receivers, Fig. 7. Optimized transmitter-receiver spacing configurations and multi-frequency operation enable the tool to assess the metal loss in each individual pipe string. The transmitters induce eddy currents in the surrounding metal tubulars, generating a waveguide mode and a lateral-wave mode. The receivers measure the electromagnetic field induced by the currents that flow in the near-field, transition, and far-field zones. The measured signal provides a total-thickness calculation for determining pipe integrity.

An inversion method is used to identify the location and magnitude of corrosion-induced defects, i.e., metal loss, in each concentric string. The 11/16-in. tool is run centralized at a current maximum logging speed of 15 ft/min, and can be combined with other cased-hole diagnostic logging tools. The minimum tubular outer diameter is 23/8-in., maximum outer diameter of the first tubular is 7-in., maximum casing size is 24-in., and the maximum total metal thickness is 2½-in. The tool is rated to 350°F and 15,000 psi, and operates in continuous mode on either monoconductor wireline or slickline (in memory mode). Slickline operation allows rig-less intervention.44,45
Production logging. Most conventional production logging methods have difficulty providing accurate quantitative inflow profiling in horizontal wells producing at low rates (<150 m2/D), due to the decreasing reliability of the measured data as borehole inclination increases. Schlumberger reported on an experimental prototype tool designed to measure inflow profiles in low-rate horizontal wells. The tool, which is based on an azimuthally distributed array of six thermal anemometers to determine inflow profiles, would provide an additional diagnostic dataset used for characterizing fluid inflow. The sensors records overheating profiles along a well; overheating profiles depend on the local velocity of the fluid and its phase composition. The periodic heating regime of the sensor enables measurement of the undisturbed fluid temperature for determination of overheating and acquiring high-resolution temperature profiles.46
RESERVOIR MONITORING
Distributed acoustical sensing (DAS). A study seeking lower-cost alternatives to geophones for VSP surveys found that DAS receivers: 1) can provide time-depth curves comparable with those of the geophone, but require a precise depth calibration; 2) are less suitable for amplitude studies than geophone or hydrophone receivers, because their directionally dependent sensitivity makes DAS first-break amplitudes less reliable; 3) cased DAS receivers can produce good-quality reflections comparable with that of the geophones, however loose DAS is affected by tube-wave contamination, similar to that of hydrophones; and 4) F-K analysis between physically coupled and passively coupled receivers for all three receiver types is comparable.47
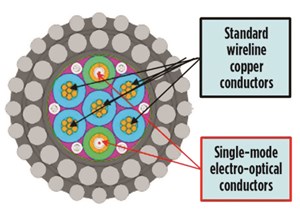
Hybrid electro-optical cable. The development of electro-optical hybrid cable allows conventional wireline logging and single-component time-depth and velocity data to be conducted simultaneously on the same run, thereby reducing rig time significantly, Fig. 8. This option is preferred to using a separate run of geophones or dip-in DAS fiber optic, The fiber-optic cable conductor of the hybrid cable is connected to independent DAS acquisition unit at surface that collects seismic data in parallel with logging operations. This system is undergoing field trials.48,49
Disposable fiber-optic sensors. An innovative system of disposable distributed fiber-optic sensors has been designed to provide a low-cost and low-risk deployment method for fiber-optic sensors. The Well-SENSE system uses “bare” fiber optics that are deployed by free-fall into the well. Following data acquisition (typically several hours), the system is disposed of in the well. Tests indicated that the fiber can be deployed successfully and reliably in a well, and that a DAS survey can be performed on each fiber installed.50
Multi-component seismic with DAS. The use of multiple helically wound optical fibers can provide directional strain data to enable high-resolution multi-component DAS data.51 Researchers at the Colorado School of Mines propose a configuration of five equally spaced constant-pitch helical fibers and one straight fiber, to obtain the six different strain projections needed to reconstruct all components of the 3D strain tensor at a point along the fiber.52 ![]()
References
- Liu, H., Principles and applications of well logging, Springer, ISBN 9783662549773, 2017 .
- Yang, S., Fundamentals of petrophysics, Springer, ISBN 9783662550298, 2017.
- Schön, J. H., “Physical properties of rocks; fundamentals and principles of petrophysics, 2nd Edition,” Developments in Petroleum Science 65, Elsevier, ISBN 9780081004043, 2015.
- Anovitz, L. M., and Cole, D. R., “Characterization and analysis of porosity and pore structures,” Reviews in Mineralogy & Geochemistry, 80, 61–104, 2015.
- Lai et al., “A review on pore structure characterization in tight sandstones,” Earth-Science Reviews, 177, 436–457, 2018.
- Barnaby, R.J., “Quantitative image analysis for geologic core description,” Journal of Sedimentary Research, 87, 460–485, 2017.
- Sander et al., “Laboratory measurement of low permeability unconventional gas reservoir rocks: A review of experimental methods,” Journal of Natural Gas Science and Engineering, 37, 248–279, 2017.
- Ghanizadeh et al., “Permeability standards for tight rocks: Design, manufacture and validation,” Fuel, 197, 121–137, 2017.
- Bolt, H., “Driller’s depth quality improvement: Way-point methodology,” Petrophysics, 58(6), 564–575, 2017.
- Pineda, W., and J. Bergeron, “Understanding wireline depth control in wells with high cable tension and best practices to account for wireline stretch while performing stationary measurements,” DDDD paper presented at the SPWLA 58th Annual Logging Symposium, Oklahoma City, Okla., USA, June 17–21, 2017.
- ElGizawy et al., “Is while-drilling true vertical depth true?” SPE paper 188921, presented at the Abu Dhabi International Petroleum Exhibition and Conference, Abu Dhabi, UAE, Nov. 13–16, 2017.
- Monterrosa et al., “MWD survey enhancement techniques and survey management workflows applied at a Barents Sea field for accurate wellbore positioning,” SPE/IADC paper 184678 presented at the SPE/IADC Drilling Conference and Exhibition, The Hague, The Netherlands, March 14–16, 2017.
- 13.Herland et al., “The CHAOIS-X model and uncertainty values for magnetic directional surveying,” SPE paper 185895, presented at the SPE Bergen One Day Seminar, Bergan, Norway, April 4–5, 2017.
- Kabirzadeh et al., “Variable in-field geomagnetic referencing for improved wellbore positioning in directional drilling,” SPE paper 188653, presented at the Abu Dhabi International Petroleum Exhibition and Conference, Abu Dhabi, UAE, Nov. 13–16, 2017.
- Sawaryn, S.J., “Well collision avoidance management and practice,” SPE paper 184730, presented at the SPE/IADC Drilling Conference and Exhibition, The Hague, The Netherlands, March 14–16, 2017.
- Sawaryn et al., “Well collision avoidance—separation rule,” SPE paper 187073, presented at the SPE Annual Technical Conference and Exhibition, San Antonio, Texas, Oct. 9–11, 2017.
- ISCWSA, “Wellbore ranging technologies, intercept applications and best practices,” ISCWSA Well Intercept Subcommittee Ebook, 2017. http://www.iscwsa.net/download/4762c0a8-fa59-11e7-8fc6-258dc249882c/.
- Shi et al., “Development and field evaluation of a distributed microchip downhole measurement system,” SPE paper 173435, presented at the SPE Digital Energy Conference and Exhibition, The Woodlands, Texas, March 3–5, 2015.
- Li et al., “Implementation of a drilling microchip for downhole data acquisition,” SPE paper 186330, presented at the SPE/IATMI Asia Pacific Oil and Gas Conference and Exhibition, Jakarta, Indonesia, 17–19 October 17–19, 2017.
- Gardner et al., “Micro-sonde well logging system,” SPE paper 185893, presented at the SPE Bergen One Day Seminar, Bergen, Norway, April 5 ,2017.
- Wacher et al., “Collaboration delivers LWD triple-combo breakthrough for ultra-high-temperature wells,” World Oil, 238(9), 69–72, 2017.
- Leonard et al., “Development of transducer and electronics technology for an LWD ultrasonic imaging tool,” OTC paper 27758, presented at the Offshore Technology Conference, Houston, Texas, May 1–4, 2017.
- Cartellieri et al., “New optical sensor system for improved fluid identification and fluid typing during LWD sampling operations,” SPE/IADC paper 184717, presented at the SPE/IADC Drilling Conference and Exhibition, The Hague, The Netherlands, March 14–16, 2017.
- Schlumberger, “Pretest probe module,” service datasheet 15-DR-58789; “Fluid mapping module,” service datasheet 15-DR-31026; and “Sample carrier module,” service datasheet 15-DR-58706, 2017.
- Tost, B., “Instantly ‘see’ drilling kicks with MWD/LWD data,” Hart’s E&P, 90(7), 110–111, 2017.
- Tost et al., “Kick detection at the bit: Early detection via low-cost monitoring,” U.S. Department of Energy, National Energy Technology Laboratory report NETL-TRS-2-2016; EPAct technical report series, 2016.
- Donadille et al., “Slim, high-resolution laterolog array tool: First field experiences,” URTeC paper 2671192 presented at the Unconventional Resources Technology Conference, Austin, Texas, USA, July 24–26, 2017.
- Haddad et al., “Design, field testing, and application of a new through-the-bit fullbore microelectrical imaging tool in unconventional reservoirs of North America,” SPE paper 187153, presented at the SPE Annual Technical Conference and Exhibition, San Antonio, Texas, Oct. 9–11, 2017.
- Inanc, F., and M. McCleskey, “Gamma ray API definition-related issues and model based tol characterization and calibration,” RRRR paper, presented at the SPWLA 58th Annual Logging Symposium, June 17–21, 2017.
- Moake, G., “Characterizing natural gamma-ray tools without the API calibration formation,” Petrophysics, 58(5), 485–500, 2017.
- Luycx, M., and C. Torres-Verdin, “Resolution and accuracy of neutron-gamma density measurements compared to conventional gamma-gamma density measurements,” SPE paper 187114, presented at the SPE Annual Technical Conference and Exhibition, San Antonio, Texas, Oct. 9–11, 2017.
- Swidinsky, A., and C. Weiss, “Cutting through the smoke (ring): Logging thin beds by a coincident-loop transient electromagnetic induction tool,” SEG paper 17252876, SEG Technical Program Expanded Abstracts, 1189–1193, 2017.
- Epov et al., “Electromagnetic tool for high-resolution logging: Theoretical and experimental studies,” SPE paper 187904, presented at the SPE Russian Petroleum Technology Conference, Moscow, Russia, Oct. 16–18, 2017.
- Lacuve et al., “A method to improve adhesion strength at the cement/steel-casing interface and its effect on cement evaluation log response,” OMC paper 2015-243, presented at the Offshore Mediterranean Conference and Exhibition, Ravenna, Italy, March 25–27, 2015.
- Eulberg, J., and M. Hudson, “Fiber technology improves cement bonding and eliminates sustained casing pressure,” SPE paper 185625, presented at the SPE Western Regional Meeting, Bakersfield, Calif., April 23–27, 2017.
- 3Heathman et al., “Development of nanotechnology pipe treatment to improve acoustic cement evaluation,” OTC paper 27893, presented at the Offshore Technology Conference, Houston, Texas, May 1–4, 2017.
- Wang, H., and M. Fehler, “A cement bond evaluation method, based on the full waveform from a monopole tool,” SEG paper 17739858, SEG Technical Program Expanded Abstracts 2017, 875–879, 2017.
- Patterson et al., “Extending the understanding of in-situ cement properties,” Paper SPWLA FF, presented at the SPWLA 57th Annual Logging Symposium, June 25–29, 2016.
- Kalyanraman et al., “Making sense of why sometimes logs do not see cement in the annulus,” SPE paper 185731, presented at the SPE Western Regional Meeting, Bakersfield, Calif., April 23, 2017.
- Nair et al., “Detecting poor cement bonding and zonal isolation problems using magnetic cement slurries,” Paper SPE-187047 presented at the SPE Annual Technical Conference and Exhibition, Oct. 9–11, 2017.
- Khalifeh et al., “Technology trends in cement job evaluation using logging tools,” SPE paper 188274, presented at the Abu Dhabi International Petroleum Exhibition and Conference, Abu Dhabi, UAE, Nov. 13–16, 2017.
- Musselman, J., “Eliminating guesswork,” Hart’s E&P, 90(9), 62–63, 2017.
- Weatherford, “Raptor 2.0 cased-hole evaluation tool,” service datasheet 7899.07, 2017.
- San Martin et al., “New high-definition frequency tool for tubing and multiple casing corrosion detections,” SPE paper 188932, presented at the Abu Dhabi International Petroleum Exhibition and Conference, Abu Dhabi, UAE, Nov. 13–16, 2017.
- Halliburton, “Electromagnetic Pipe Xaminer V (EPX V) tool, Service Datasheet H012406, 2017.
- Miklashevskiy et al., “New production logging tool for inflow profiling of low-rate oil and water horizontal wells: Case studies of field testing an experimental prototype,” SPE paper 187901, presented at the SPE Russian Petroleum Technology Conference, Moscow, Russia, Oct. 16–18, 2017.
- Van Zaanen et al., “A comparison of borehole seismic receivers,” SEG paper 17799478, SEG Technical Program Expanded Abstracts, 5974–5978, 2017.
- 48.Borland et al., “Improving the acquisition efficiency of acquiring borehole seismic data by recording optical distributed acoustic data on a wireline hybrid electro-optical cable,” SEG paper 13951115, SEG Technical Program Expanded Abstracts 2016, 800–804, 2016.
- Kimura et al., “Borehole seismic acquisition using fiber-optic technology: Zero rig-time operation,” SEG paper 17678368, SEG Technical Program Expanded Abstracts 2017, 936–940, 2017.
- Higginson et al., “Advancing the application of downhole fibre optics with a novel low-cost disposable deployment methods,” SPE paper 186124, presented at the SPE Offshore Europe Conference and Exhibition, Aberdeen, UK, Sept. 5–8, 2017.
- Hornman, J.C., “Field trial of seismic recording, using distributed acoustic sensing with broadside sensitive fibre-optic cables,” Geophysical Prospecting, 65(1), 35–46, 2017.
- Lim et al., “High-resolution multicomponent distributed acoustic sensing,” Paper SEG-17679990, SEG Technical Program Expanded Abstracts 2017, 941–946, 2017.
- Folger et al., “Innovative conveyance systems saves $9.4M on a deep water, high angle well in the Nam Con Son basin,” SPE paper SPE184773 presented at the SPE/ICoTA Coiled Tubing and Well Intervention Conference and Exhibition, Houston, Texas, March 21–22, 2017.
- Driving MPD adoption with performance-enhancing technologies (January 2024)
- Rig electrification drives down emissions, bolsters efficiency while improving onshore drilling economics (October 2023)
- Wellbore seal control and monitoring enhance deepwater MPD operations (October 2023)
- Advancing casing drilling to deepwater: Rethinking top hole well construction (August 2023)
- Mobile electric microgrids address power demands of high-intensity fracing (July 2023)
- Utilizing electronic data captured at the bit improves PDC design and drilling performance (July 2023)
- Applying ultra-deep LWD resistivity technology successfully in a SAGD operation (May 2019)
- Adoption of wireless intelligent completions advances (May 2019)
- Majors double down as takeaway crunch eases (April 2019)
- What’s new in well logging and formation evaluation (April 2019)
- Qualification of a 20,000-psi subsea BOP: A collaborative approach (February 2019)
- ConocoPhillips’ Greg Leveille sees rapid trajectory of technical advancement continuing (February 2019)

