Industry at a glance
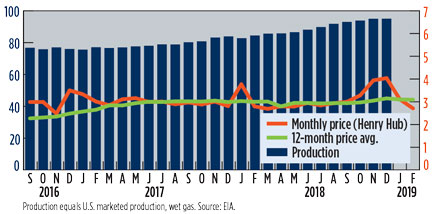
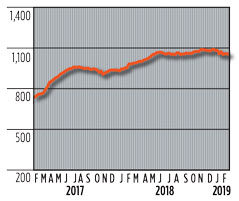
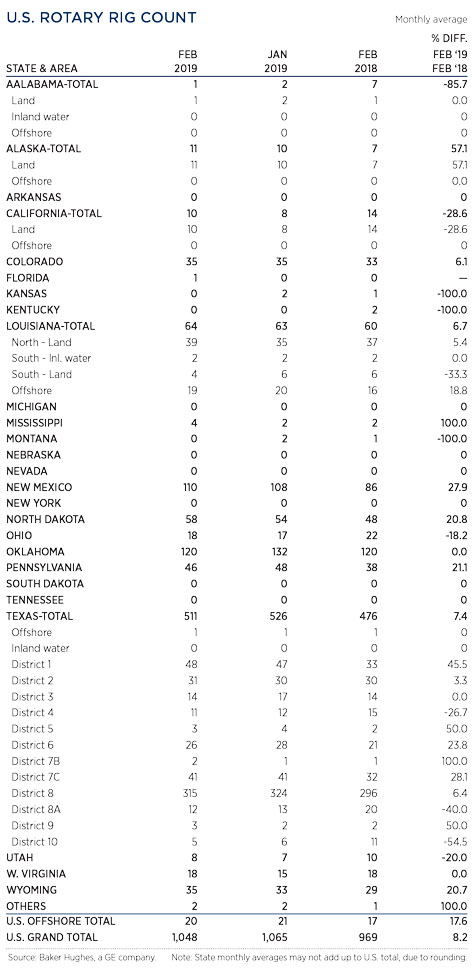
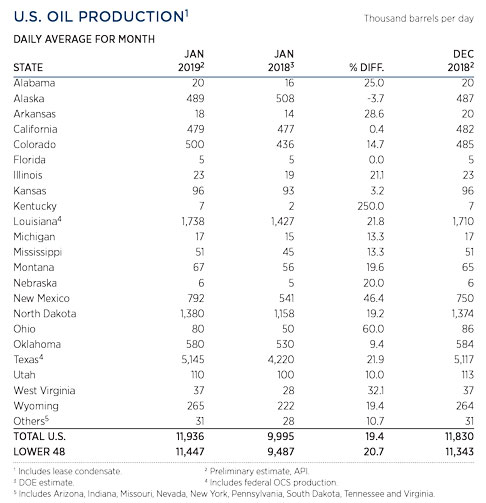
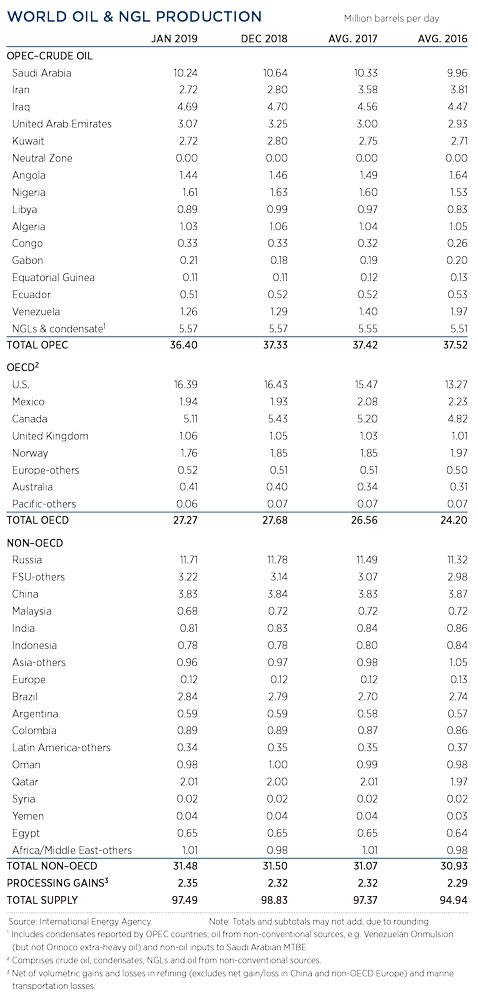
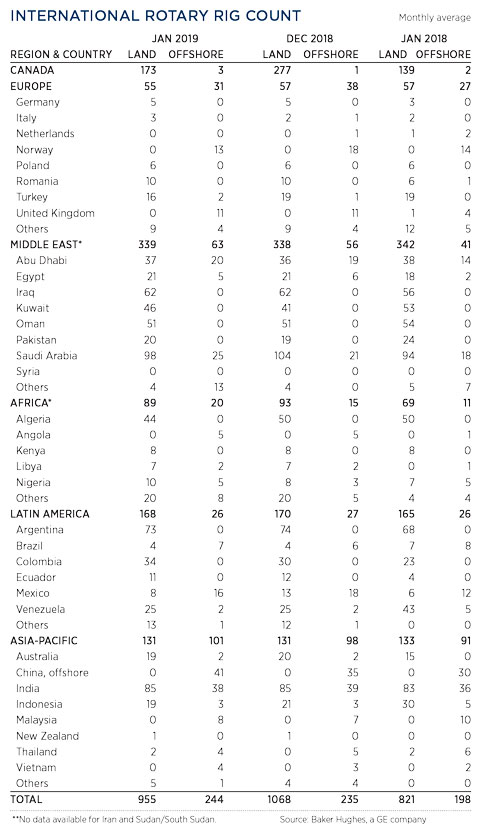
U.S. oil production surged to another all-time high when output averaged 12.0 MMbpd in January, up 90,000 bpd from December 2018’s level. In February, the U.S. imported the lowest volume of crude on a weekly basis in 23 years, when imports fell 1.61 MMbpd, to 5.92 MMbpd (EIA). Russia reduced its production by 70,000 bpd, to 11.38 MMbpd, and Saudi Arabia cut 400,000 bpd from its daily total, down to 10.24 MMbpd. The reductions by OPEC+ have caused prices to rally 25% this year. Gas prices dropped 13% in February, down to $2.71/MMBtu, after suffering a 23% decline in January. Drilling in U.S. shale fields is slowing, with Texas District 8, Oklahoma and Pennsylvania all registering losses. Overall, the U.S. rig count averaged 1,048 in February, 17 units less than averaged in December. International activity decreased 104 rigs, to average 1,199 in January.
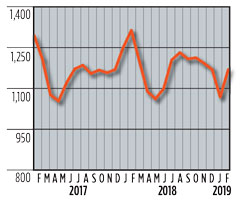
U.S. GAS PRICES ($/MCF) AND PRODUCTION (BCFD) GRAPH
U.S. ROTARY DRILLING RIGS GRAPH
U.S. ROTARY DRILLING RIGS TABLE
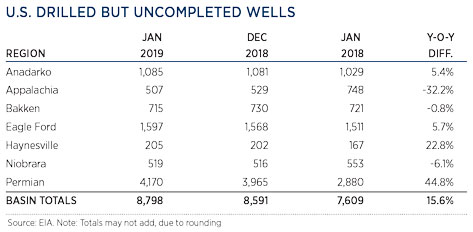
U.S. DRILLED BUT UNCOMPLETED WELLS
U.S. OIL PRODUCTION TABLE
WORLD OIL PRODUCTION TABLE
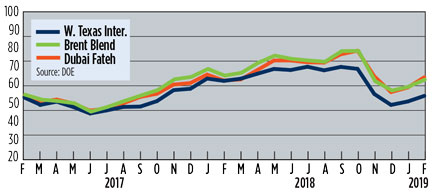
SELECTED WORLD OIL PRICES GRAPH
INTERNATIONAL ROTARY RIG GRAPH
INTERNATIONAL ROTARY RIG TABLE
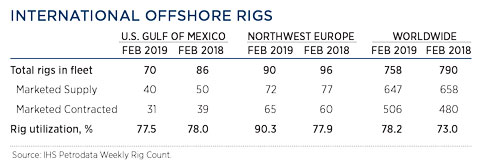
INTERNATIONAL OFFSHORE RIGS TABLE


