When slick is not smooth: BHA selection and its impact on wellbore quality
Wellbore quality and the impact of tortuosity on operations has been an area of increasing study in recent years. Several methods for measuring tortuosity have been proposed, ranging from modelling the wellbore as a spline, to evaluating the sharpness of “curve-turns,” adding up accumulated curvature, and acquiring extremely high-frequency survey data to map micro-tortuous sections. Focused studies have presented cases where unwanted curvature can cause problems for drilling, casing and completion operations. However, when larger datasets have analyzed these effects in aggregate, the strength of correlation has not been as strong as these case studies would suggest.
A contributing factor to this discrepancy may be the inability of standard survey measurements to fully model wellbore tortuosity, particularly for wells drilled with mud motor assemblies. While having high-frequency survey data from either a gyroscopic instrument or continuous measurement-while-drilling tools would always be preferred for analysis, the realities of high-volume drilling operations suggest that methods need to be developed that do not rely on these additional data for successful analysis, particularly in cases where historical data analysis is required.
Incentives in drilling operations. While the relationship between the directional contractor and the operator is largely collaborative, in matters of wellbore quality, it is common for their individual incentives to not be completely aligned. For the contractor, the primary motivation is to retain work, once it has been acquired. In high-volume North American land operations, where directional services are viewed as highly commoditized, this primarily happens through several means:
- Reduce immediate drilling costs to the operating company.
- Minimize the likelihood of a tripping for poor slides.
- Demonstrate the value of field knowledge / drilling heuristics.
Generally, directional contractors have several incentives to promote the use of high-bend, under-stabilized BHAs for unconventional lateral wells. In some cases, these choices stem from an explicitly stated operator preference for speed over other objectives. Other times, this is through the implied preference of aggressively landing a curve high rather than risking a curve coming in low. For these unstated preferences, the immediate incentives of the operator and the directional contractor may not be aligned, to the point that decisions left to the directional contractor may not be optimizing value for the operator. In the case of wellbore quality, a full engineering analysis would suggest that different BHAs should be used, though the extent to which changes are needed may require a more rigorous quantification of operator needs and relative value.
BHA DATA SET
The study data set included 29 BHAs used in the Permian basin and 32 BHAs used in the Eagle Ford shale, spanning more than 10 operators and 15 directional contractors. These were analyzed for their sliding and rotating tendencies across a range of drilling parameters, using a commercially available drillstring modelling package. The BHAs were categorized, based on motor bend angle and level of stabilization. A high bend-angle motor was considered one to have 2° of bend or greater. Stabilization was broken into three categories, based on how many of the first three contact points were being controlled: 1) a Slick BHA, which has no meaningful components wider than the nominal gauge of the motor; 2) a BHA with a near-bit-stabilizer (NBS) that also includes kick-pads; and 3) a well-stabilized BHA (NBS+SS) where there is a near-bit stabilizer present, as well as a second string stabilizer above the mud motor.
BHA performance modelling. A BHA model is used to calculate the build and turn rate of a steerable mud motor system by coupling the bit’s behavior and deflection of the drillstring. This model calculates the lateral and axial forces transmitted to the bit by evaluating the drillstring deflection, contact points along the BHA, and overall reactive forces. The resultant orientation of the bit translates to a drilling direction by evaluating the weight applied on the bit to the lateral forces transmitted on the side of the borehole, Fig. 1.
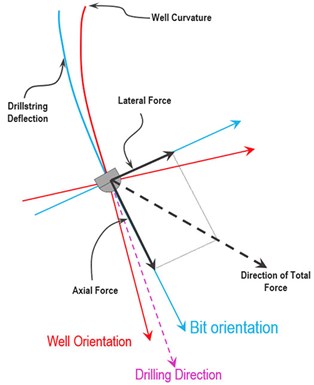
FIG. 1. Bit-BHA model.
The software used in this study accounts for a number of properties known during the BHA design phase and accounts for a range of factors to predict BHA behavior:
- Bit profile – cutting profile to determine axial and lateral force at the bit
- Formation hardness – UCS
- Motor collar OD – flexibility
- Motor bend – motor yield DLS
- Kick pad – contact point
- Bit to bend distance – motor yield and side load
- Near bit stabilizer OD – contact point, pendulum effect
- Stabilizer position – contact point, pendulum effect
- Stabilizer OD – contact point, regulate build/drop/hold tendency.
Once a BHA is complete, the next step is calculating the build/turn rates of the system, using downhole conditions and operating parameters. The BHA model has over eight variables for the drilling environment that can be tuned to improve modelling results. For example, weight is never fully transferred to the bit while sliding due drag of the string in the wellbore, so simulating downhole conditions improves directional response prediction. Similarly, high bend motors tend to create a larger borehole, so simulating the drilling system with some amount over gauge is key to producing a realistic model. To perform the most robust analysis, it is best to complete a full calibration of all the parameters. This can be a time-consuming process where iterative analysis of post-drilling data is used to determine best-fit parameters. This may also involve the incorporation of additional data, such as borehole caliper logs and logs of formation strength.
In the absence of detailed data, less precise results can be achieved through the use of local heuristics and sensitivity analysis, where several models are run across a parameter range that is likely to contain the true parameter value. As a heuristic, 0.25-in. for over-gauge was assumed, as in the authors’ experience with U.S. land motor BHAs, around 2° is a good starting point for post-drill analysis. Sensitivity analysis was performed for WOB, and models were run across a range of values.
BHA modelling parameters - calculating build/turn rates through sensitivity analysis:
- WOB effect – when weight is applied, the bend housing creates a side force at the bit in the direction of the bend. Therefore, varying WOB will produce changes in motor yield.
- Inclination angle – at lower well inclination angles between 0-15°, motor yields will be lower, compared to ones at higher inclination angles (motor laying on low side of the hole).
- Over-gauge effect – calibrating over-gauge is crucial (loss of fulcrum) for understanding motor yields.
- Formation/steerability effect – the bit will react differently, drilling hard formations versus soft. Calibrating the drilling system to a formation hardness can lead to a more predictable BHA.
When performing model analysis with many parameters and limited measured data, there is an ever-present risk of overfitting and manipulation, ultimately introducing the biases of the investigator into the results of the model. To minimize the possibility of this bias, a set of parameters was defined that was believed to reasonably cover most North American land drilling prior to selecting or directly analyzing the BHA data. This introduced the risk that cases may be selected that were entirely contained within the modelled parameter ranges, but it is the authors’ belief that for an initial study, this risk is balanced by the need for an unbiased result. For the modelling performed in this study, the parameters were varied as follows:
- Weight on bit: 25-45 klbs
- Inclination angle: 5-85°
- Over-gauge: 0.25-in.
- Steerability: 20%.
BHA performance stability. While all BHAs modelled in this study had built capacity in excess of requirements in the well plan, analyzing the ability to repeatably drill high-quality wellbores also requires evaluation of the consistency at which those build capacity are achieved with respect to process variation. Figure 2 shows a comparison of how the modelled build rates change with respect to weight-on-bit and inclination for a fully stabilized BHA and a slick BHA. In both cases, these BHAs were selected to drill curves in the Permian basin that have been planned for 10°/100 ft.
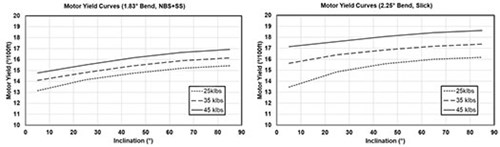
Fig. 2. Modelled motor yield stability for stabilized and slick BHAs.
Key observations. First, to ensure the required build rates are achieved with the slick assembly, much greater motor bend angles are employed (2.25° vs. 1.83°). It is unclear from this study whether the greater bend angle is a technical requirement or related to a perceived risk of missing the curve with a reduced-bend under-stabilized assembly. Drilling with a higher bend motor has been linked to additional drilling dysfunctions, such as higher levels of bit whirl. There is also a difference in the change in performance seen when WOB is varied. The build-rate window for the fully stabilized BHA shows less variability across inclinations, with approximately 2°/100 ft of variation.
For the slick assembly, a much greater level of variation is observed (2.5° to 3.5°/100 ft), with the larger changes at low inclinations. This wider range of motor yield with respect to drilling parameters means not only that it will be more challenging to drill a consistent curve, but also that operators may be unwittingly forced to choose between sacrificing wellbore quality and drilling a faster well (with higher WOB). The authors would like to note that while in this example the stabilized assembly has several desirable properties, this will only hold true if the assembly is designed in a fit-for-purpose manner. Using stabilizers in BHA design provides degrees-of-freedom not available to the slick assembly user. When used correctly, this can be advantageous to the drilling program, but incorrect use may also have the potential to exacerbate existing problems.
BHA MODEL VALIDATION
While the BHA modelling software used has been validated previously in a range of drilling operations applications, given the particularly narrow scope of this study (curve BHAs used to drill curves in unconventional laterals), additional validation was performed to ensure suitability.
Maximum observed dogleg. The first method used to broadly validate the BHA models used for the study was to compare the estimated motor yield against the directly observed performance of each BHA. It is a common practice in U.S. land drilling to have a full slide or nearly full slide early in the curve, both to “get ahead” of the well plan and to confirm the directional capabilities of the BHA, in the event it is needed later in the well.
Figure 3 shows the range of modelled results for each BHA, color coded by type. For well modelled BHAs executing full slides, one would expect the data to lie along the grey diagonal line. A range of values from the model is shown from the sensitivity analysis of each BHA, as it is not known for certain under what conditions this maximum dogleg would have occurred. Most assemblies in both basins’ observed data were in line with model expectations. Deviations above the grey line are most likely wells that did not execute a full slide between survey points, given the excessive capability of the BHA. Notably some assemblies overperformed their modelled expectations (data falling below the grey reference line). This may be due either to using WOB that was outside of the modelled range or to incorrect assumptions about bit steerability and hole overgauge.
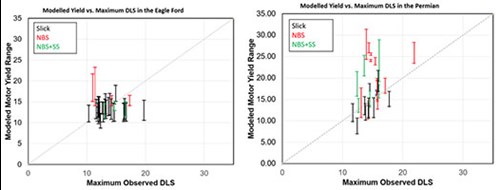
Fig. 3. Maximum dogleg severity vs. modelled motor yield ranges.
Slide sheet comparisons. For nine of the curves analyzed in this study, automated slide sheets were available for analysis. An automated slide sheet is a record produced by analyzing data from an electronic drilling recorder to determine specifically: 1) which depths sliding occurred; 2) what the recorded tool faces from the MWD system were during the slide; and 3) what drilling parameters were used throughout the slide. From these data, an effective motor yield can be estimated by analyzing how much of each survey course length was a slide, the precision at which the slide was held, and the dogleg severity measured by the surveys. This effective motor yield would be the expectation from a full-course length, highly precise slide.
It is worth noting that this analysis implicitly contains the assumption that all curvature in a survey course length comes from the sliding interval. For drilling a curve where most of the footage is slide-drilled this assumption is reasonable. Figure 4 shows an example comparing the calculated yields from the slide sheets to those estimated by the model for two slick assemblies, one from the Eagle Ford and one from the Permian.
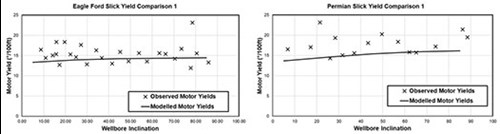
Fig. 4. Motor yields from slide sheets vs. model estimates.
For most of the assemblies analyzed, there was strong agreement against the modelled BHA performance and the calculated motor yields. There were some notable deviations that merit mention: For most assemblies, the accuracy degraded at higher inclination. This is due to the low slide ratios that were being used to land the curve. Given all BHAs analyzed had a large amount of excess build capacity, and that high dogleg severities were often seen early in the curve, by the time landing point is reached, only short slides are required. For these short slides, the BHA’s rotary tendency will have a greater impact on the observed curvature, causing the motor yield to be over- or underestimated.
For two wells in the Permian, several slides used weights-on-bit outside the range used in the BHA build rate model. In one case, the weight-on-bit was so erratic, slide-to-slide, that it was below the low end for some slides and above the high end for others. As mentioned previously, for under-stabilized BHAs, the motor yield can be a strong function of weight-on-bit, so this variance may lead to a poor modelling result. In addition to these two considerations, better modelling of the bit-rock interaction (through steerability analysis) and better modelling of hole overgauge are potential methods of improving the model-data agreement further.
Curvature analysis. A straightforward method for defining unwanted curvature in a wellbore trajectory, using only the survey data, has been proposed by Jamieson (2019). This method starts with the assumption that extended, constant curvature sections are inherently smooth, and therefore desirable. Conversely, changes in the measured curvature are used as a proxy for undesirable tortuosity, measured either as an accumulation of unwanted curvature or as a normalized tortuosity index. A key advantage of this method is that it enables estimation of wellbore quality in a manner that is independent of the well plan, as intuitively factors influenced by wellbore quality (such as increased torque and drag) should be independent of variables that exist outside the as-drilled execution of the wellbore.
For each BHA used in the study, unwanted curvature was calculated through the landing point of the curve. The data set for this study was not large enough to statistically separate all factors considered in BHA performance, so modelled motor yield was used as a proxy for all decisions that involve increasing the aggressiveness of the BHA (via higher bend angles, shorter bit-to-bend distances, and changes in stabilization).
It has been noted in literature that 95-ft course lengths for surveys are inadequate for properly mapping wellbore tortuosity. To get a better model of true wellbore tortuosity, an estimated pseudo-trajectory for each wellbore was generated, where slide-rotate sequences of the modelled BHA behavior were used to reconstruct each observed survey set.
Figure 5 shows a comparison of inclination measurements for the standard surveys when compared to the inferred pseudo-trajectory. In this case, the reported survey average dogleg severities were around 8-10°/100 ft when the BHA was modelled as capable of 14-15°/100 ft across those same intervals. The likely wellpath drilled with this assembly would have concentrated areas of curvature in the sliding sections, followed by areas of low curvature in the subsequent rotary sections. Without properly accounting for expected BHA behavior, no method of estimating wellbore quality will be able to identify this additional curvature from only the reported surveys.
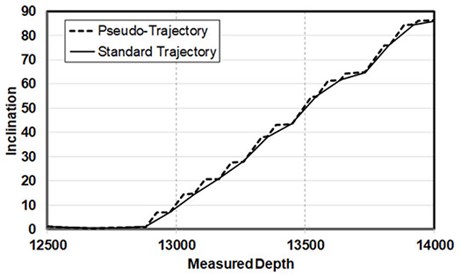
Fig. 5. Inclination comparison for standard trajectory vs. pseudo-trajectory.
When using the standard survey reports to estimate the amount of unwanted curvature (Fig. 6), there is little to no observable relationship between the amount of unwanted curvature in the trajectory and aggressiveness of the BHA for the Eagle Ford (r2 = 0.01), and only a small effect observed for the Permian (r2 = 0.16). This implies that either unwanted curvature is being hidden by survey aliasing effects of long course-lengths, or it requires the somewhat paradoxical conclusion that more aggressive BHAs continue to be employed, despite not producing additional curvature in practice.
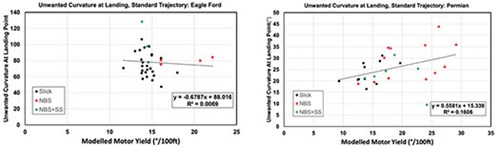
Fig. 6. Relationship of BHA aggressiveness to unwanted curvatures in standard trajectories.
When the same analysis is performed, using the pseudo-trajectories that incorporate expected BHA model behaviors (Fig. 7), the relationship between unwanted curvature and motor yield is present. For the Permian basin, there was a strong, direct relationship (r2= 0.75), while this relationship was much less pronounced in the Eagle Ford (r2= 0.19). A potential limitation of this analysis is that in the Eagle Ford, there was far less diversity in anticipated motor yields (often in the 14-16°/100 ft range), which may mean that other differences in drilling practices had a greater effect on wellbore quality than the relatively minor differences in BHA performance for much of the dataset.
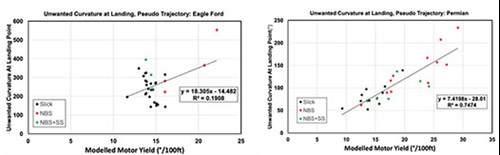
Fig. 7. Relationship of BHA aggressiveness to unwanted curvatures in pseudo trajectories.
To estimate the amount of curvature that may be missed by conventional tortuosity analyses, the ratio of unwanted curvature for a pseudo-trajectory, relative to its standard trajectory, was plotted against expected motor yield, Fig. 8. For the Eagle Ford, the results from the large number of slick BHAs are highly variable, compared to the fully stabilized BHAs, even when modelled to provide similar performance. This supports the notion that drilling behaviors with a slick BHA are more likely to depend on how it is used by a directional driller.
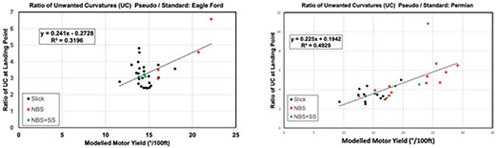
Fig. 8. Ratio of observed vs. estimated unwanted curvature as a function of BHA aggressiveness.
This feature was not noticeable in the Permian, likely due to the greater variety in BHAs, even within the various classifications. Also of note is a considerable outlier for a fully stabilized BHA in the Permian that was over-specified for the well plan it was used on. In this case, ratio of unwanted curvatures was exacerbated by an exceptionally low amount of unwanted curvature observed on the standard trajectory.
For both basins, the amount of unobserved, unwanted curvature increases with the aggressiveness of the BHA. The correlation in this instance is quite notable because the parameter used for prediction (modelled motor yield) can be generated prior to the start of drilling. The correlation values of 30% to 50% imply that a meaningful contribution of the unmodelled, unwanted curvature stems from the tool being provided to drill, independent of the practices employed using that tool. This implies that successful implementation of a workflow to increase wellbore quality must have serious consideration given to the bottom hole assembly.
CONCLUSION
An analysis of over 60 BHAs, spread across two major basins, was performed. A strong bias was found toward the use of understabilized assemblies with high motor bends (>2 degrees). This bias held true across multiple operators and drilling contractors. These assemblies were often capable of achieving 150% to 200% or more of the dogleg severity required by the corresponding well plans. While the full effect of these aggressive BHAs on tortuosity cannot be directly observed in conventional survey records, the hidden, unwanted curvature at landing was estimated using pseudo-trajectories based on modelled BHA tendencies. In some cases, the amount of hidden, unwanted curvature was more than five times the amount that would be estimated by traditional means. This hidden, unwanted curvature was directly related to the excess directional capacity available in the drilling assembly.
These results are in line with expectations for a process optimized toward reducing immediate costs associated with well construction, at the expense of long-term value that comes from improved wellbore quality. Given the high level of discretion granted to directional contractors when selecting a BHA, it stands to reason that the BHAs favor their short-term incentives for demonstrating value rather than a holistic approach that maximizes net-present-value for the companies that hire them. As greater focus is placed on the repeatable drilling of high-quality wellbores, a similar emphasis must be placed on the tools used to drill them. Using proper BHA modelling and design, assemblies with predictable, repeatable, and fit-for-purpose directional capabilities can be used to reduce this hidden curvature and improve overall outcomes for the operator.
While this study qualitatively shows a link between BHA selection and wellbore quality, there is still a great deal of work still to be done. Through targeted refinement of the BHA model for specific use cases, a more quantitatively robust assessment of unmodelled curvature would almost certainly be produced. Similarly, the use of additional data, such as continuous inclination and azimuth could be employed to either better validate the BHA model, or to directly quantify the additional curvature in the wellbore trajectory that is not captured in the traditional survey record. Finally, the largest gap that remains is developing more direct links between drilling practices and impacts to operations after drilling, so that a clear set of incentives can be established for directional providers to ensure their decision-making is aligned with overall value to the operator.
ACKNOWLEDGEMENTS
The authors would like to thank management at Helmerich & Payne and DrillScan for granting them the time and permission to work on this project. They also wish to recognize the employees at the H&P Remote Operating Centers in Denver, Colorado, and Goa, India, for validating BHA information, so this analysis could be completed. This article contains excerpts from SPE paper 204129, presented at the IADC 2021 virtual event.
- Drilling advances: What is the Performance Twist-Off cost? (September 2024)
- General Bond Log Interpreter completes interpretation, based on standardized rules and data formats (September 2024)
- Faster drilling speeds drive savings and efficiency in the oil patch (September 2024)
- EY says U.S. E&P fared well in 2023 while ESG reporting increased further (September 2024)
- Automated iron roughneck and advanced robotics system enhance rig floor operations (September 2024)
- Decarbonizing drilling operations using more efficient electrical utility power (September 2024)

