Real-time operations center drives new ESG opportunities by integrating personnel and data
A real-time operations center (RTOC) is not a new concept to the industry. Starting in the early 1990s, several major companies built data information centers to compile daily drilling reports via fax. In the early 2000s, with the rapid development of the internet and wide adoption of drilling data protocols such as WITSML, many operators and rig contractors were able to remotely view the rig operations via electronic drilling recorder (EDR) sensor data and daily rig reports.
The RTOC initially played more of a remote monitoring role instead of interfacing with rig operations directly. One of the reasons is that well construction is a complicated process. A significant amount of rig information and data have still not fully streamed to the remote office. It is believed that operational decisions should be made at the rig site, as onsite personnel have first-hand information and have the physical ability to respond, as needed.
Essentially, it is more difficult for office staff to make the decision remotely with limited information and data streaming to the RTOC and then communicate actions to the rig site. The main initial responsibilities of RTOC include:
- Data management, to ensure continuous data streaming from the rig to the office.
- Model preparation, such as building torque-drag and surge and swab models.
- Operation surveillance, to detect dysfunctions and alert the rig crew, based on certain communication protocols.
Since 2010, the new development of digital transformation and process automation has enabled the industry to expand the RTOC role from strictly remote monitoring to remote operations and other responsibilities. Beyond remote monitoring, the RTOC can work more effectively with rig operations, as well as support Environmental, Social, and Governance (ESG) efforts through the integration of systems and technology.
By using an integrated platform, such as Parker Wellbore’s Automated Digital Analytic Platform™ (ADAPT), data from multiple systems is accessible to the RTOC and Operations. Data from systems—such as the rig’s EDR, the rig’s engines, assets management system and computerized maintenance management system (CMMS), enterprise resource planning (ERP) system, knowledge base/lessons learned data, and engineering/drilling model data—allow a unified and coherent picture of the entire company’s ecosystem. Having all these data at the fingertips of the RTOC and rig site personnel enables for more efficient support from the RTOC and safer, more reliable operations with less downtime.
Moreover, having direct communication via technology—such as mixed reality devices between the RTOC and rig site personnel—allows for a smaller technical workforce. Given the restrictions on travelling experienced during Covid and the shrinking pool of qualified new personnel available and willing to work offshore, this technology, coupled with the RTOC, can provide the solution. Along those lines, we see the following two promising trends for the upcoming RTOC development.
Remote operations to increase competitive edge. Directional drilling (DD) is probably the first rig operation transferred into the RTOC as part of the remote operation initiatives. For example, a major operator can support multiple DD operations in the Permian basin from its Houston RTOC center. The initial success demonstrated with the firm’s land rigs shows significant potential to expand to offshore rigs. The value includes reductions in personnel onboard (POB) and costs, in addition to quality and consistency improvement.
The pandemic has changed the way in which we work and how we conduct our lives in a variety of ways. However, one of the positive Covid effects is to mandate more remote operations. Besides drilling operations, rig maintenance work holds potential for remote operational support. With capabilities to capture vital equipment data in real time, the RTOC becomes a major support arm for maintenance efforts across global operations. From the start, safety operation windows and smart alarms can be set to alert the RTOC and maintenance teams, when a certain parameter falls or rises to a critical level. As more data are gathered, models can be developed, using artificial intelligence (AI) and machine learning (ML) for predictive failure analytics. By capturing this type of data, the RTOC can not only support drilling optimization, but also the performance of rig equipment.
Recent developments in wearable technology, such as Microsoft HoloLens and RealWear, allow for more efficient remote collaboration with subject matter experts all across the globe. Whether completing routine maintenance or addressing a critical issue in operations, these devices can quickly, and effectively, connect the end-user with a remote expert in the RTOC to support in the process. Beyond remote collaboration, workflow procedures and assessment checklists can be developed onto the devices, to allow for a technician to have virtual instructions and documentation available, hands-free for use on the task.
These new, wearable, mixed reality devices, such as Microsoft HoloLens and RealWear, can be used in hazardous locations (HoloLens Zone2 and RealWear Zone 1) and, as in the case of RealWear, be affixed to a hard hat. RealWear may hold more potential than HoloLens to our industry, due to the device design. The RealWear devices allow the user to continue to have a natural view of the world, with an adjustable eye piece that gives them access to digital data. These data include drawings, solid models of equipment, work instructions or procedures, and many other data types. With the capability of these devices to provide two-way video and audio, the local user (technician on a rig for example) can work directly in real time with an SME in the RTOC or other support center.
As offshore technology advances, it requires local maintenance and operational personnel to continually evolve their skill sets to maintain and use the equipment. This poses challenges, due to a large portion of the offshore workforce retiring recently and/or in the next few years. With few offshore personnel available to recruit (i.e., those willing to work under existing conditions) it is becoming more imperative to have technology that connects individuals offshore to a pool of collective experts onshore. This reduces the rig’s POB, operating costs, and the need to retrain or recruit higher-skilled offshore personnel.
Potential applications for mixed reality devices with RTOC support can include things like operational support for tubular running services (TRS); new services or crews; rig maintenance work for equipment, such as top drives, mud pumps and BOPs; HSE reporting and investigation; and rig condition assessments.
Notwithstanding the many benefits of this technology, there are some challenges that must be considered and overcome. These can include training and integration with existing workflows and network infrastructure. The latter requires WIFI at the local rig site, which, in today’s offshore world, is generally available; however, the bandwidth is typically the biggest problem to overcome. In some instances, a portable cellular network device may be used in some areas.
Overall, the cost of additional bandwidth is outweighed by the reduction in personnel costs and the increased performance and efficiency of the operation. Moreover, this technology creates the required infrastructure to support ESG efforts, specifically around greenhouse gas (GHG) emissions.
Optimizing efficiency with data analytics. As one of the main sources of GHG emissions at a rig site, diesel fuel consumption or generator set (GenSet) data have been logged for many years. Due to the lack of automation in digital infrastructure, these data had not been fully utilized for carbon reduction.
Historically, the daily diesel fuel data were recorded manually in a spreadsheet, with static charts showing cumulative sum and fluctuation over a certain period. To push the usage of fuel data beyond bookkeeping, we must integrate daily fuel consumption data with the daily drilling report by joining both data sets in date/time. This not only allows monitoring of the fuel consumption, but more importantly, it also quantifies the fuel consumption for each drilling operation.
To better automate data collection and enable advanced analytics, Parker Wellbore initiated a cloud-based Automated Digital Analytic Platform (ADAPT) to build an all-inclusive modern data platform. This includes drilling data, key performance indicators, reports, rig equipment data, maintenance data and, of course, diesel fuel consumption data. This platform allows us to not only monitor fuel consumption, but to also quantify the fuel consumption for each drilling operation.
Once these data are integrated into a platform such as ADAPT, they can be analyzed and then visualized in such a way as to provide valuable insight into the RTOC and, thus, rig site personnel. This can enable more efficient drilling operations, reducing fuel consumption and subsequently providing a carbon reduction benefit.
This benefit is, however, easier said than done. As a real-world example of how this can be achieved, we gathered fuel consumption data from one of our operating rigs. For these specific field trials, it shows that rig engines use about 55% of total diesel, making them the top consumer amongst rig equipment. Although this is probably quite intuitive, what it doesn’t immediately tell you is “why.” Is there a specific drilling operation that drives the increase in fuel consumption; is it a characteristic of this specific geological formation; could it be a faulty engine component; or is it something else? This begs the question of how to find the main contributors among different drilling phases.
To address this question, drilling data must be synchronized with fuel consumption. During these field trials we found the following observations:
- The total amount of daily fuel consumption varies with different operations. As the rig power source, the rig generator set is always on.
- Tripping and casing running operations consume the least diesel.
- Drilling (i.e., increasing the depth of the wellbore) consumes more fuel than other operations.
- Reaming and hole cleaning circulation is the second-greatest diesel fuel-consuming operation, which is lower than drilling but higher than other rig operations.
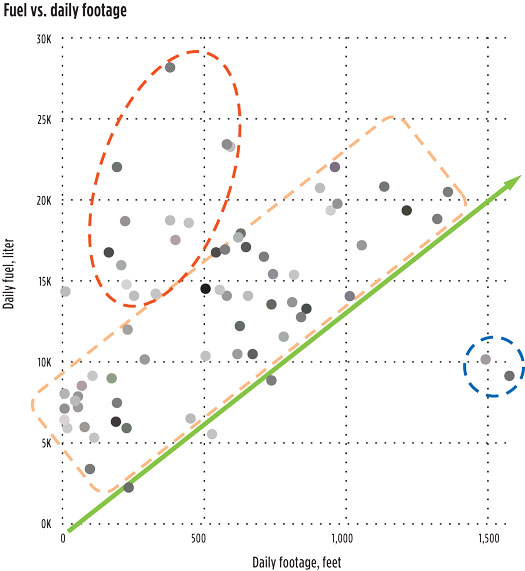
Other ways are needed to further verify the last observation, since reaming and hole cleaning circulation are typically followed by lower fuel-consuming operations, such as tripping and casing running. To tackle this challenge, data from six offset wells were processed, and then a scatter plot was created, showing a correlation between daily footage drilled vs. daily diesel consumption, Fig. 1. The gray color intensity represents different wells, and the rig operation associated with each data point is added as a tool-tip string. Then a machine learning algorithm clusters the data into the following three zones:
Least efficient zone is marked with a red dashed ellipse. Most rig operations in this zone are confirmed as reaming or hole cleaning circulation, which consumes a lot of diesel fuel in the range of 15,000 to 27,000 liters/day. Yet, it increases the depth of the wellbore at a rate of under 500 ft/day.
Sub-optimal zone is marked with an orange dashed rectangle. The daily fuel consumption increases nearly linearly with daily footage drilled, but with a variation of 10,000 liters/day. The lower boundary of this zone may be considered as an optimal line (marked with a green arrow), with a slope of 14 liters/ft, which represent the highest drilling efficiency of that rig at a rate of 0.07 ft/liter.
The slope of any data point on Fig. 1 is defined as fuel per foot (FPF), representing the volume of diesel consumed per one foot drilled. FPF is similar to the concept of mechanical specific energy (MSE), which is commonly used in the industry. The difference is that MSE does not consider energy loss due to rig engine efficiency and other energy consumptions (drilling fluid circulation, lifting drill pipes, making connection).
Conversely, FPF measures all the energy spent via diesel consumption for every foot of hole drilled. The optimal FPF may not be comparable to other rigs, because it depends on many factors, such as rock strength, wellbore/hole size, drillstring design, bit selection et.al. Therefore, for a batch drilling rig with similar well path, drillstring design, and formations, optimizing drilling operations and upgrading rig equipment will improve the optimal FPF.
Data quality issue zone, which is marked with a blue dashed circle. Those two outliers with extremely high daily footage and low diesel consumption are due to bottomhole assembly tripping in re-drills. The daily drilling report accidentally categorized the tripping operation as drilling, by using bit depth as wellbore depth. Both data points are not considered in the analysis but are still shown here to indicate the importance of data quality.
The clustering analysis reveals the following insights:
Reduce unnecessary reaming and hole cleaning circulation operations to condense the least efficient zone, Fig. 1. The rig crew may treat reaming and circulation as operational insurance for hole cleaning and tend to over-ream or over-circulate. This analysis quantifies the fuel consumption of these operations and triggers a conversation with drilling engineers about the feasibility of reducing the frequency and duration of reaming or circulation operations. In the past, we talked about reducing back reaming, merely focusing on extending the reliability of downhole tools, and now this study reveals the environmental benefit of reducing back reaming.
Know your rig limits in terms of fuel reduction. The slope of the green arrow or the optimal FPF indicates the most efficient drilling converting diesel into footage, Fig. 1. Any drilling optimization or redesign may compress the sub-optimal zone and still yield incremental fuel reduction. To further improve FPF, other equipment or energy sources may be introduced, such as providing the utility power line to the rig site and a generator set with intelligent power management. Additionally, the low-side and high-side limits of FPF may help us better estimate fuel consumption and manage the carbon footprint.
Finally, how do we achieve the most efficient day with the least fuel consumption? Figure 1 may indicate two directions for fuel reduction. One is to reduce reaming and circulation operations. The other is to compress the sub-optimal zone. To make drilling stay on, or close, to the green optimal line, analysts need to work with engineers and rig crews to surmise the engineering solutions and process redesign.
For instance, the rig crew may back-ream every stand. Is it possible to reduce the remaining frequency to every other stand? Upon reaching a sectional Target Depth, do we really need to circulate over 4 hrs? Should we check the wellbore/hole cleaning model and offset data to have a certain reduction? The data analysts should ask these questions, and engineers should redesign the process and then use the ADAPT to monitor the performance. It is also a continuous improvement process: repeating the whole optimization process to the next well and pushing the fuel consumption close to the optimal line.
Environmental aspect. Once these data have been fed into ADAPT, they can then be used by the RTOC to automate ESG reporting. With respect to the environmental piece of ESG, we can use the results of these analytics to assess and document our Scope 1, 2 and 3 emissions.
Scope 1 emissions are direct GHG emissions that occur from sources that are controlled or owned by an organization (e.g., emissions associated with fuel combustion generator sets and vehicles).
Scope 2 emissions are indirect GHG emissions associated with the purchase of electricity, steam, heat or cooling. Although Scope 2 emissions physically occur at the facility, where they are generated, they are accounted for in an organization’s GHG inventory, because they are a result of the organization’s energy use.
Scope 3 emissions are the result of activities from assets not owned or controlled by the reporting organization, but that the organization indirectly impacts in its value chain. Scope 3 emissions include all sources not within an organization’s scope 1 and 2 boundaries. The scope 3 emissions for one organization are the scope 1 and 2 emissions of another organization. Scope 3 emissions, also referred to as value chain emissions, often represent the majority of an organization’s total GHG emissions.
Scope 1 tracking represents a good starting point, as it is the simplest to implement and is fully under one company’s control. The RTOC utilizes the data to optimize operations and helps perform the data quality checks for report generation. ML/AI techniques are used to automate the report building.
Scopes 2 and 3 require more data sharing and integration, which provide an outstanding opportunity for our industry to open and share more data. This would require collaboration at an industry level to standardize on the data format and governance.
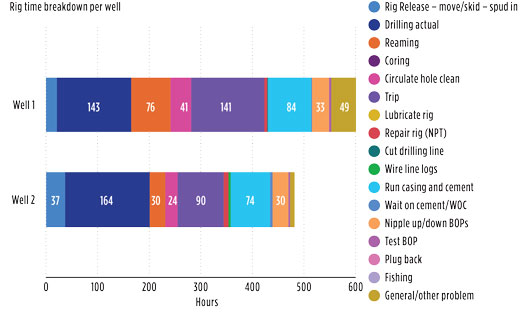
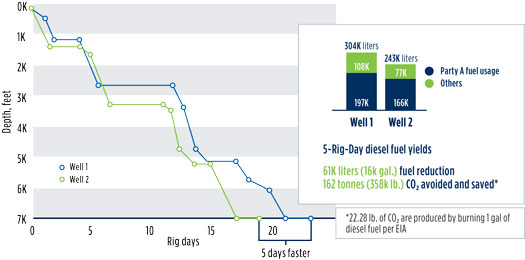
The result from our specific well field trials showed a reduction of 60% in reaming hours and 41% circulation hours, compared to offset Well 1, Fig. 2. Furthermore, Well 2 had an 82% reduction in general problems, i.e., surface equipment non-productive time (NPT). Ultimately, these performance improvements not only saved rig time by five days but also reduced fuel consumption by 16,000 gal, Fig. 3. Assuming 22.38 lb of CO2 is produced by burning one gallon of diesel fuel (EIA), then the amount of fuel reduction is equivalent to 358,000 lbs of carbon emissions.
VALUE POTENTIAL
By integrating people and data with the RTOC, new opportunities and synergies are created to help reduce the environmental impact that our industry makes on the world. At the same time, this increases efficiency and adds business value.


- Aramco's upstream digital transformation helps illuminate the path toward excellence (June 2024)
- Adopting a holistic approach to cybersecurity (March 2024)
- Embracing automation: Oil and gas operators leverage new operational efficiencies (May 2024)
- The five A’s on the road to completions automation (May 2024)
- Digital’s influence on drilling and production keeps growing (March 2024)
- Taming the red zone with automation (April 2024)

