Operational field procedure for identifying, installing and optimizing a gas lift well
Gas Lift is a primary artificial lift method applied to extended-reach horizontal wells, as pictured at Sakhalin Island and to be relinquished by ExxonMobil because of Russia’s invasion of Ukraine, and to Permian basin horizontal shale wells. Each has the characteristic of long horizontal bores subject to slug generation, which requires sufficient gas lift gas to maintain stable flow, but with differences.

Sakhalin wells have gas lift injection near the toe of the horizontal, whereas Permian wells inject at a depth less than the kickoff point. Either type of construction requires procedures for identifying, installing and optimizing technical, as well as field, operations for a gas lift well.
Section A of this article reviews the gas lift well candidate related to gas content in the reservoir fluid and a choice of gas lift or pumping. Section B discusses the well completion related to dimensional and clearance considerations and gas lift facility requirements. Section C has guides for starting a well and avoiding erosion cutting of the unloading valves. Finally, Section D provides the procedure to optimize the well, once it has unloaded and is operating in the production system.
SECTION A: GAS LIFT WELL CANDIDATES
Reservoir conditions are primary drivers in choosing artificial lift. Gas content is key, since gas lift supplements existing gas in the reservoir fluid, and high content reduces the gas lift contribution. However, pumps are adversely affected by gas content in the reservoir fluid, leading to lower effectiveness and frequent failures. Production rate is a consideration that affects tubular size in gas lift, but changes pump choice with rod/beam pumps for lower rates and electric submersible pumps (ESPs) for higher rates. Finally, sand production from a sandstone reservoir or frac sand from a horizontal shale well have a detrimental effect on pump operation but a lesser effect on gas lift.
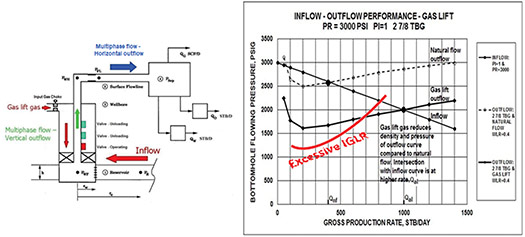
The fundamental relationship of gas lift with the reservoir is explained. Figure 1 shows a gas lift schematic on the left and the pressure-rate behavior of flow from the reservoir (inflow) and up the tubing string (outflow) on the right. The gas lift well has gas entry through the tubing-casing annulus to the operating valve or orifice, mixing with reservoir gas, oil and water to reduce the composite density of the fluid flowing to the wellhead and on to the separator. The chart at right shows the pressure versus rate for the inflow from the reservoir, based on a PI = 1 bbl/d per psi and PR = 3,000 psig. Each well is tested to obtain its productivity index (PI, related to IPR, Inflow Performance Relationship) and reservoir pressure (PR).
These data are coupled with a nodal analysis program, such as SNAP, to evaluate different tubing diameters and select the most appropriate size. The other curves on the chart are multiphase flow results for 27/8-in. tubing outflow (called Vertical Lift Performance VLP, J-Curve, Tubing Intake, or Outflow) for natural flow and for gas lift. The intersection of the inflow curve and the outflow curve indicates a point of stable operation. The chart shows the natural flow curve (of higher density and pressure compared to gas lift) intersecting the inflow line at 400 stb/d, whereas the gas lift curve (of lower density and lower bottomhole flowing pressure) is intersecting at 1,000 stb/d. The gas lift outflow curve is for a specific injection gas-to-liquid ratio (IGLR, scf/bbl).

Although more injection gas would continue to decrease density, friction increase more than offsets the density reduction, which is shown by the third curve in red, representing excessive IGLR that reduces production rate. IGLR plus formation gas to liquid ratio (FGLR) gives total gas-to-liquid ratio (TGLR). Notice that all “outflow” curves decrease in bottomhole flowing pressure (negative slope), where density is the governing factor, and then they increase (positive slope) as fluid velocity and friction become dominant. The friction effect limits gas lift production rate for a specific tubing size, but ESPs are not as strongly affected and can go to higher rates.
SECTION B: GAS LIFT WELL DIMENSIONAL AND GAS FACILITY CONSIDERATIONS
Figure 2 is the gas lift well completion schematic, showing the arrangement of tubing, casing, and gas lift valves, with distinction made between unloading valves and a bottom orifice for continuous injection. The wellbore can be vertical, inclined or horizontal, since most lift equipment is installed above the kick-off point, the exception being Sakhalin extended-reach wells.
Prior to drilling, a tubing/casing size evaluation is conducted, using exploration or prior well data as estimates for PI and reservoir pressure. If the reservoir has the rate capacity, and engineering concurs that higher rates will not damage the reservoir rock nor preclude reserves recovery, then a larger-sized tubing and corresponding casing can be recommended.
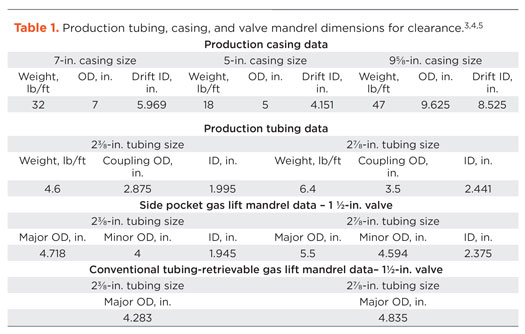
Once tubing/casing sizes are selected, a detailed dimensional analysis is required. The gas lift mandrels and associated valves are eccentric (both conventional tubing-retrievable and side pocket with wireline-retrievable valves), and clearance between the casing and tubing must be assured. The inside drift diameter of casing must be compared to tubing coupling outside diameter and to gas lift mandrel major diameter.
Table 1 has tubing, casing, and gas lift mandrel dimensional data for a clearance check. The 95/8-in. casing string from Fig. 2 has a drift diameter of 8.525 in., much larger than the major outside diameter (OD) of a 27/8-in. gas lift mandrel (95/8-in. casing is usually paired with 3½-in. or 4½-in. gas lift completions). The 7-in. liner has a drift diameter of 5.969 in., which will clear the 27/8-in. gas lift mandrel major OD of 5.5 in. for a side pocket or 4.835 in. for a tubing-retrievable option. Downhole data confirm clearance, so attention can be turned to surface facilities.
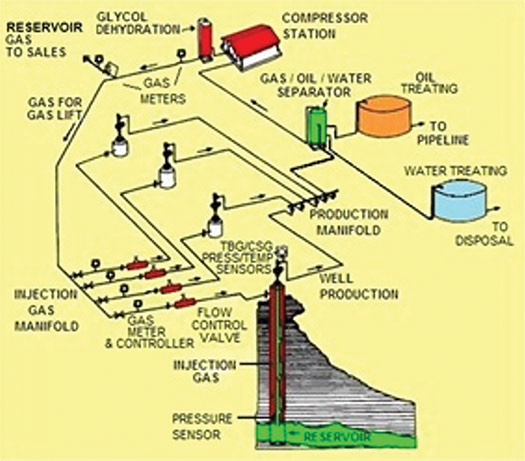
Gas compressors, dehydrators, and meters are the crucial complements to the wellbore, subsurface valves, and low pressure gathering/treating facilities of the gas lift system, Fig. 3. All operations staff will tell you that gas lift success depends on near-100% run time from compressors, dehydrators, and gas lift gas meters. The rate and pressure available to each well must be adequate and steady. If compressors go down every few days, due to poor maintenance or old equipment, then the gas lift system cannot stabilize.
Wells are always in a start-up mode, not steady-state operation. If dehydration is malfunctioning or the triethylene glycol (TEG) is so fouled that it cannot absorb water vapor from the gas stream, then hydrate at chokes, regulators, distribution piping, or fuel gas supply lines will cause individual wells, or portions of the field, or the entire field, to go offline. Liquid accumulation over years, due to condensing water vapor in the piping system, can lead to corrosion, liquid slugging, and loss of gas transmission efficiency. Since most gas lift gas is dehydrated but unprocessed solution gas, plus returning lift gas, it usually contains heavy hydrocarbon components that can condense and accumulate in the piping system, causing problems.
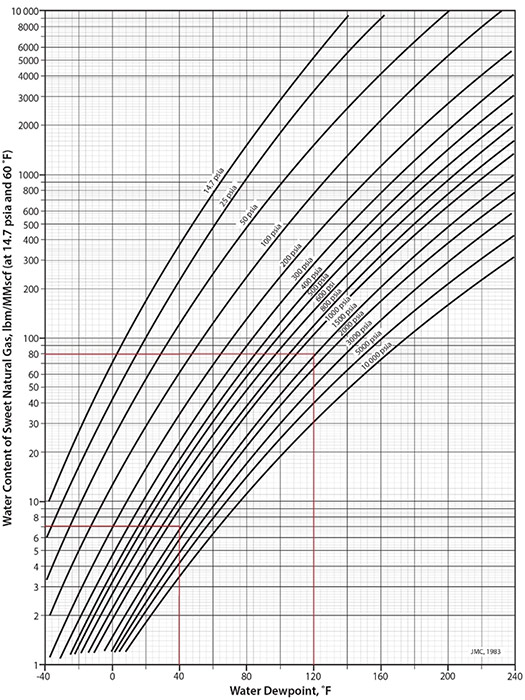
The critical quality of gas lift gas centers on water content in the gas at compressor discharge pressure and temperature. The value can be estimated from Fig. 4. At compressor discharge downstream of the aftercooler, the pressure is 1,400 psig, and temperature is 120°F. The water content point on the chart is 80 lbs water vapor per million standard cubic feet (MMscf) of gas. To prevent water condensation down to 40°F at 1,400 psig, the water content must be reduced to 7 lbs water per MMscf, and the TEG dehydrator must remove 73 lb/MMscf. Colder climes often require 1 lb/MMscf to achieve a dew point of -10°F, which requires 79 lb/MMscf water vapor removal. These estimates set the dehydration requirement to prevent water condensation in the piping, which leads to hydrate, corrosion, and water accumulation.
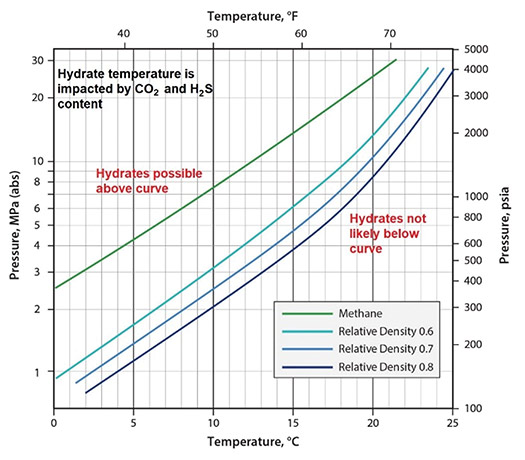
When the dehydrator is out of service for an extended period, or if dehydration is not installed under the false assumption of no problem with hydrate, corrosion, or water accumulation in the injected gas piping system, then a chart (Fig. 5) is used to predict hydrate formation pressure and temperature, based on the gas lift gas specific gravity (ranges from 0.65 to 0.8). Gas lift gas (0.7 specific gravity or relative density) at our example, 1,400 psig discharge pressure, could form a hydrate at approximately 68°F, which, during normal operation, could occur at pressure expansion (and cooling) locations at chokes, regulator valves, and piping low points where water accumulates. As weather cools, many points, including the main pipeline or laterals, could be subject to hydrates. Methanol or ethylene glycol injection stations would be required at potential hydrate points to keep the gas lift operating.
SECTION C: GAS LIFT WELL UNLOADING GUIDE
An important first step is extracting the control (kill) fluid that is used by the completion/workover team to permit safe installation of the downhole equipment. Even though blowout preventers (BOP) are used, control (kill) fluid in the wellbore tubing and tubing-casing annulus is the primary barrier to prevent reservoir fluid flow. With the well full of control (kill) fluid, the BOP is removed and replaced with the tree of valves and flanges. Now the critical unloading of the well can be slowly initiated to prevent erosion of valves/mandrels, as the control (kill) fluid passes from the annulus to the tubing, where it flows up to the wellhead, to be removed from the well.
Damage prevention to valves and mandrels requires actions prior to installing the downhole equipment and after tree installation. The following practices are applied during the workover to install the packer, tubing, mandrels, and valves:
- a) Circulate the wellbore to remove any drilling mud before perforating, running other completion equipment, and installing the gas lift valves.
- b) Use a casing scraper to remove debris that adheres to the casing wall and burrs created when packers were set; circulate the casing clean.
- c) Use filtered completion and workover fluids and leave filtered fluid in the tubing-casing annulus. Unfiltered fluids are a source of solids that can either cut out or plug the gas lift valves.
Unloading the control (kill) fluid from the tubing and annulus is initiated after the well is secured to the production facility:
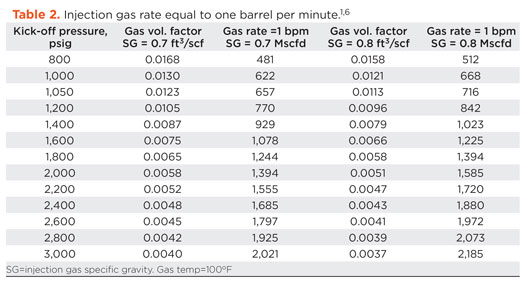
- a) Displace with unloading rates not exceeding 1 barrel per minute (BPM), Table 2, to prevent erosion of gas lift valves.
- b) Start injection gas flow, control rate to attain a 50-psig casing pressure increase in 10 min. increments.
- c) Continue this injection rate until the casing pressure reaches 400 psig.
- d) Increase the injection gas rate to achieve a 100-psig increase in 10 min. increments.
- e) Monitor for an injection gas pressure drop and the return of aerated fluid from the production tubing, to indicate gas is injected through the top unloading valve.
- f) Observe and record casing pressure (downstream of injection choke or regulator valve) to confirm casing pressure decline, as injection point transfers to deeper valves.
- g) Use acoustic fluid level tools in the casing annulus to confirm depth of injection.
- h) Ensure that injection gas flow is continuous and not surging.
The depth of injection is related to reservoir pressure (and corresponding tubing pressure), compared to the casing injection pressure. Early operating life may have gas lift injection at a mid-point in the wellbore, but as reservoir pressure and tubing pressure decline with time, the injection point will automatically shift to a deeper valve where gas injection pressure is greater than tubing pressure.
Testing after unloading, coupled with nodal analysis simulation from each valve mandrel depth, can indicate the point of operation, illustrated in Fig. 6. This figure shows the well unloaded to the deep mandrel at 8,000 ft, Test 1, but a compressor outage caused a shift to the shallow mandrel at 4,800 ft, Test 2, (the well may not automatically return to the deep point of injection after the restart).
Operators adjusted the injection rate, and another test indicated lift at the 7,150-ft mandrel, Test 3. A subsequent test showed a return to the mandrel at 8,000 ft, Test 4. When the well is unloaded to the depth possible, based on available injection pressure, and confirmed with acoustic fluid level and testing, then optimization testing can begin.

SECTION D: GAS LIFT WELL OPTIMIZATION
Optimization, based on well tests, is an ongoing process, since the reservoir inflow performance is continually changing, and injection gas needs to be allocated to the best wells in a group supported by the same compressor station. However, confirmation of deep lift (related to available injection pressure) should be done first, based on the prior section. The well tests, flowing gradient surveys, and measured flowing bottomhole pressure data from permanent sensors are used to build nodal analysis models that accurately describe the wells’ response to greater or lesser amounts of injection gas.
The well performance curve, previously shown in Fig. 6, is also called an “optimization” curve and charts gross production (oil and water) rate versus injection gas rate. Each well in the field is tested over a range of 80% to 120% of design injection rate; the results permit choice of operating point, based on some criteria: maximum oil, best economic condition, flow stability to minimize slugging, water injection capacity limit, injection gas capacity limit. The group of wells in a facility can have injected gas allocated to achieve the “optimum” operating point for each well. Often, optimization is not attained.
When wells falter, and optimum points cannot be achieved, troubleshooting techniques are applied to obtain data for problem resolution. Diagnostic techniques, solutions and problems are addressed in tables published in the PetroSkills Gas Lift manual1 and API RP 19GLHB Gas Lift Handbook.6
SUMMARY
This review provides information on gas lift well selection and its inflow relationship with the reservoir; on wellbore and facility parameters that must be addressed for operational success; on the critical stage of unloading control (kill) fluid that is in the wellbore following all interventions to install downhole equipment; and on the optimization procedure, plus a link to trouble shooting guides.
Section A links gas lift choice to reservoir gas content, since high available reservoir gas requires a lesser supplement from gas lift. The effect is density reduction in the wellbore, and nodal analysis graphs are used to indicate the difference between a lower natural flowrate and a higher gas lift rate that results from the lower pressure in the bottom of the bore. Nodal analysis with SNAP is used to evaluate interdependence of reservoir productivity, tubing size (with corresponding casing size), and gas lift injection pressure availability.
Section B has an example that compares tubing, gas lift mandrel eccentricity, and casing drift diameters to assure that the equipment can be installed in the wellbore. Downhole evaluation is necessary, as is a review of surface facilities. Success with gas lift depends on high-reliability compressors and dehydrators that provide steady gas capacity without hydrates or liquid accumulation.
Section C provides guides to the crucial step of removing the control (kill) fluid without causing erosional cutting of valves/mandrels. Damage control involves actions prior to installing the wellbore hardware and precautions during the fluid extraction procedure. Displacement of control (kill) fluid is limited to 1 bpm, deemed by testing to be the maximum rate where erosion will not occur.
Section D provides the multi-rate well test optimization procedure to obtain gross production rate versus injection gas rate, varied over a range of 80% to 120% of design rate. This test phase begins after the well is confirmed to be lifting at a depth consistent with the available injection pressure. An “optimum” operating point is selected, based on criteria such as maximum rate, or economic return, or flow stability, or capacity limits of injection gas or injection water. When testing reveals a problem, then troubleshooting analysis begins, using the guides found in the PetroSkills Gas Lift Manual or API Gas Lift Handbook.
This article is one of three that appeared in PetroSkills’ Tip-of-the-Month series. (Visit https://www.petroskills.com/en/blog/category/tip-of-the-month~n3809 to read Part 1 and 2). The authors are consulting engineers with expertise in surface and subsurface facilities and teach PetroSkills courses; we express our gratitude to Kindra Snow-McGregor and to Mahmood Moshfeghian for their valuable review and feedback.
REFERENCES
- John Martinez, PetroSkills Gas Lift (GLI) course manual.
- Mehdi Abbaszadeh Shahri, M.S., PhD, Texas Tech, 2011.
- Halliburton Red Book of API Tubing and Casing Data.
- Schlumberger, Camco Gas Lift Catalog.
- Weatherford, Gas Lift Catalog.
- API RP 19GLHB, Gas Lift Handbook.
- Campbell, J. M., Gas Conditioning and Processing, Volume 1: The Fundamentals, 9th Edition, 3rd Printing; Editors, Hubbard, R. and Snow–McGregor, K., Campbell Petroleum Series, Norman, Okla., PetroSkills, 2018


- Annular safety valves advance flexibility, reliability and safety in completion operations (July 2024)
- Aramco's upstream digital transformation helps illuminate the path toward excellence (June 2024)
- Adopting a holistic approach to cybersecurity (March 2024)
- Embracing automation: Oil and gas operators leverage new operational efficiencies (May 2024)
- Dawn of a new day in completions (May 2024)
- Extracting resources from the Earth’s crust using multi-stage, fraced horizontal wells: First gas, then oil, now heat (May 2024)

